
7 Data Scrubbing Techniques to Master Pristine Data
Why Data Scrubbing Matters
Clean data is crucial for accurate analysis and informed decision-making. This listicle presents seven key data scrubbing techniques to refine your data and improve results, whether you're building complex formulas in Excel or managing large databases. Learn how techniques like regular expression (regex) data cleaning, ETL processing, data normalization, outlier detection, data imputation, data deduplication, and natural language processing (NLP) can transform your raw data into reliable information. These data scrubbing techniques empower you to generate accurate insights and make better decisions.
1. Regular Expression (Regex) Data Cleaning
Regular Expression (Regex) data cleaning is a powerful data scrubbing technique that leverages pattern matching to identify, validate, and manipulate data. It allows you to define specific patterns within text data and then perform actions like finding and replacing text, removing special characters, validating formats (like email addresses or phone numbers), and extracting specific information from unstructured text. This makes Regex an invaluable tool for data analysts and business intelligence professionals, as well as anyone working with large datasets or text-heavy information like log files. Think of it as a highly specialized search-and-replace tool with superpowers. It can handle complex string manipulations that simple string functions often can't, making it ideal for intricate data cleaning tasks.

Regex is language-agnostic, meaning it’s available in most programming languages (like Python, Perl, Java, and even within spreadsheet software like Excel), offering flexibility in implementation across different platforms and tools. Its highly customizable nature makes it adaptable to various data formats and capable of efficiently handling large volumes of text data. This efficiency makes it particularly useful for repetitive text cleaning operations, allowing you to automate tasks and significantly reduce manual effort. For those working with spreadsheets, Regex can drastically simplify tasks like standardizing data across different cells or validating input formats in web forms.
Features and Benefits:
- Pattern-based search and replace: Enables precise targeting of specific text patterns for modification.
- Complex string manipulations: Facilitates advanced operations beyond basic string functions.
- Language-agnostic: Usable across a wide range of programming languages and tools.
- Highly customizable: Adaptable to specific data formats and cleaning needs.
- Efficient for large datasets: Automates repetitive cleaning tasks for improved productivity.
Pros:
- Flexibility: Extremely versatile for handling various text cleaning tasks.
- Power: Handles complex patterns that simple string functions can't manage.
- Efficiency: Automates and speeds up repetitive cleaning operations.
- Wide Availability: Integrated into most programming environments without external libraries.
- Automation: Easily incorporated into scripts and workflows for large datasets.
Cons:
- Complexity: Steep learning curve due to its syntax.
- Maintainability: Complex expressions can be difficult to debug and understand later.
- Performance: Overly complex patterns can degrade performance.
- Limited Applicability: Not suited for all data types or cleaning problems.
- Error Prone: Requires careful testing to avoid edge cases and unexpected results.
Examples of Successful Implementation:
-
Email validation: Ensuring email addresses entered in web forms follow a valid format using patterns like
^[\w.-]+@[\w.-]+\.[a-zA-Z]{2,}$. - Phone number standardization: Cleaning and formatting phone numbers in CRM systems for consistency.
- Log file parsing: Extracting key information from log files in IT operations for analysis and troubleshooting.
- Web scraping: Targeting and extracting specific data points from websites based on content patterns.
- Data migration projects: Standardizing text data during migration to ensure data quality and compatibility.
Tips for Using Regex:
- Start simple: Begin with basic patterns and gradually increase complexity.
- Use testing tools: Validate expressions using online regex testers like regex101.com.
- Document your work: Add comments to complex patterns to improve readability and maintainability.
- Consider performance: Be mindful of performance impact when using complex patterns on large datasets.
- Build a library: Save tested and reusable regex patterns for common use cases.
Learn more about Regular Expression (Regex) Data Cleaning
Regex, popularized by figures like Ken Thompson (the inventor of regular expressions) and Jeffrey Friedl (author of "Mastering Regular Expressions"), has become an indispensable tool for data scrubbing. Its power and flexibility make it a cornerstone technique for anyone dealing with data cleaning challenges, from data analysts and finance teams to spreadsheet enthusiasts and anyone working with text-heavy datasets. Regex earns its place on this list due to its ability to handle complex cleaning tasks that other methods simply cannot address.
2. ETL (Extract, Transform, Load) Processing
ETL (Extract, Transform, Load) is a powerful data scrubbing technique that plays a crucial role in ensuring data quality and consistency. It involves a three-step process: extracting data from various source systems, transforming the data to meet specific operational needs and conform to a standardized format, and finally, loading the transformed data into a target database or data warehouse. This foundational approach enables organizations to create a reliable and unified view of their data, making it suitable for analysis, reporting, and decision-making. ETL is a core component of many data scrubbing techniques because it provides a structured framework for cleansing, validating, and preparing data for downstream use.
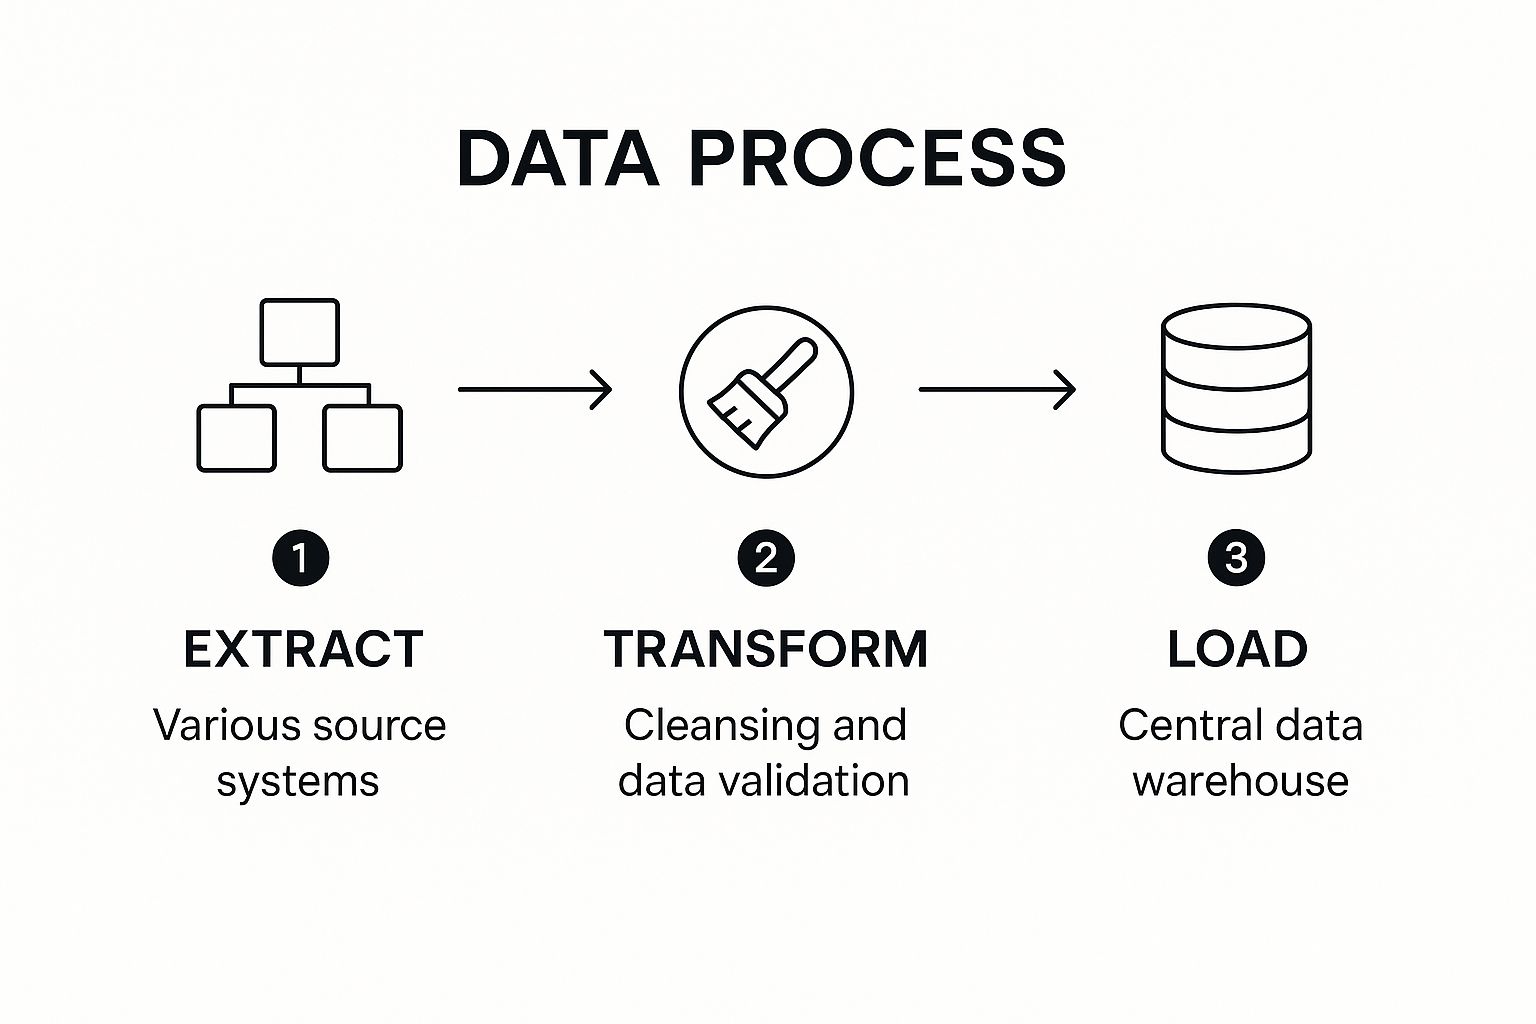
The infographic visually represents the ETL process flow, highlighting the sequential nature of extracting, transforming, and loading data. It depicts data flowing from diverse sources into the Extract stage, passing through various transformation operations in the Transform stage, and finally being loaded into a target data warehouse. The infographic clarifies the interconnectedness of the three stages and the importance of each step in achieving a clean and consistent dataset.
ETL offers a comprehensive framework for data quality management, handling complex transformations between disparate systems and supporting both structured and unstructured data. Features like end-to-end data pipeline architecture, batch or real-time processing capabilities, support for heterogeneous data sources and formats, built-in data validation and cleansing operations, data transformation logic (joins, aggregations, calculations), and metadata management with lineage tracking make it a robust solution. For instance, ETL provides audit trails and data lineage, crucial for compliance and understanding data origin. It can be scheduled and automated, scaling to handle enterprise-level data volumes.
The benefits of ETL are significant. It enables data integration from multiple sources, improves data quality through cleansing and standardization, and enhances data accessibility by consolidating information into a central repository. This streamlined process supports better business intelligence, improved decision-making, and enhanced operational efficiency.
However, ETL is not without its drawbacks. It can be resource-intensive, particularly for very large datasets. Real-time applications might experience latency, and specialized skills and potentially expensive tools are often required. Complex ETL processes can be challenging to maintain, and significant infrastructure may be necessary.
ETL is invaluable for diverse applications, from Salesforce data integration with enterprise data warehouses to healthcare systems consolidating patient records. Financial institutions rely on ETL for processing daily transaction data, while retail companies use it to harmonize inventory data across multiple systems. Even government agencies leverage ETL to integrate citizen data across departments.
Learn more about ETL (Extract, Transform, Load) Processing
Here are some tips for successful ETL implementation: design for failure recovery and restartability; implement data quality checks at every stage; thoroughly document transformation rules and business logic; consider incremental loading for large datasets; implement proper error handling and notification systems; and start with a pilot project before scaling to enterprise level. Pioneers like Ralph Kimball, along with companies like Informatica, Talend, and providers of solutions like Apache Airflow, NiFi, AWS Glue, and Microsoft SSIS, have significantly popularized ETL. By leveraging ETL effectively, organizations can transform raw data into a valuable asset, driving insights and informing strategic decisions.
3. Data Normalization: A Crucial Data Scrubbing Technique
Data normalization is a powerful data scrubbing technique that enhances data quality and prepares it for analysis and modeling. It involves rescaling numerical data to a common range, eliminating inconsistencies and improving data integrity. This process is crucial for ensuring accurate insights and reliable results from data analysis and machine learning algorithms. While often confused with database normalization, which focuses on optimizing database structure, data normalization as a data scrubbing technique deals primarily with the values within the dataset itself. This distinction is key for data analysts and business intelligence professionals working with datasets outside of a relational database context.
How Data Normalization Works:
Data normalization involves applying a mathematical formula to transform numerical values to a predefined scale. Several methods exist, each with its own characteristics:
- Min-Max Scaling: Scales data to a range between 0 and 1. This is useful for algorithms sensitive to feature scaling, like K-Nearest Neighbors.
- Z-score Normalization: Transforms data to have a mean of 0 and a standard deviation of 1. This method is beneficial when data follows a normal distribution and helps in comparing features with different scales.
- Decimal Scaling: Moves the decimal point of the values to make them fall within a smaller range, often between -1 and 1.
Why Data Normalization Matters in Data Scrubbing:
Data normalization plays a critical role in data scrubbing for several reasons:
- Improved Algorithm Performance: Many machine learning algorithms, particularly those involving distance calculations or gradient descent, perform better with normalized data.
- Fair Comparison: Normalization enables fair comparison between features measured on different scales, preventing features with larger values from dominating the analysis.
- Reduced Computational Errors: Normalization can mitigate numerical instability in calculations, especially when dealing with very large or very small values.
- Consistency Across Datasets: By applying normalization, you ensure consistency when comparing and integrating data from different sources.
Examples of Successful Implementation:
- Financial market data analysis: Z-score normalization is frequently employed to standardize stock prices and other financial indicators for time series analysis and portfolio optimization. This allows analysts to compare the volatility and performance of different assets on a level playing field.
- Machine learning preprocessing pipelines: Min-max scaling is a standard practice in preparing data for machine learning algorithms. For example, in image processing, pixel values are often scaled to a 0-1 range before being fed into a neural network.
- Scientific research datasets: Statistical normalization techniques are used to standardize experimental data, ensuring that differences in measurement units or experimental conditions do not skew the results of statistical analyses.
Actionable Tips for Data Normalization:
- Choose the Right Method: The optimal normalization method depends on the data distribution and the specific analytical task. For instance, min-max scaling is sensitive to outliers, whereas Z-score normalization can handle them better.
- Handle Outliers: Identify and address outliers before normalization to prevent them from distorting the scaling process. Techniques include removing, capping, or transforming outlier values.
- Preserve Original Data: Keep a copy of the original data before normalization, allowing you to revert to the original values if needed.
- Consistency in Training and Testing: Apply the same normalization parameters to both training and testing datasets in machine learning to avoid introducing bias.
Pros and Cons of Data Normalization:
Pros:
- Improves algorithm performance
- Ensures fair comparison between features
- Reduces computational errors
- Minimizes data storage (in some cases)
- Creates consistency across datasets
Cons:
- May obscure original measurement scales
- Different methods produce different results
- Can amplify outlier effects if not handled carefully
- Requires domain knowledge to choose appropriate techniques
Data normalization is a valuable addition to any data scrubbing toolkit. By understanding the different techniques and applying them strategically, data professionals can significantly enhance data quality and improve the accuracy and reliability of their analytical endeavors. This technique is particularly relevant for those working with financial data, preparing data for machine learning, or conducting scientific research. From spreadsheet enthusiasts to data scientists, normalization is a key technique for ensuring robust and meaningful insights from data.
4. Outlier Detection and Treatment
Outlier detection and treatment is a crucial data scrubbing technique that focuses on identifying and handling data points that deviate significantly from the norm. These anomalous data points can skew statistical analyses, mislead machine learning models, and ultimately lead to flawed data-driven decisions. By effectively addressing outliers, you ensure a more accurate and reliable foundation for your data analysis. This technique plays a vital role in improving data quality for downstream processing, whether it's building predictive models, generating reports, or making strategic business decisions.

This data scrubbing technique utilizes various methods to pinpoint outliers, ranging from simple statistical approaches to complex machine learning algorithms. Statistical methods like the Z-score and Interquartile Range (IQR) leverage standard deviations and quartiles, respectively, to identify data points outside a defined range. Distance-based methods, such as DBSCAN (Density-Based Spatial Clustering of Applications with Noise) and LOF (Local Outlier Factor), identify outliers by considering the proximity of data points to their neighbors. For more complex scenarios, machine learning approaches like isolation forests and autoencoders offer robust outlier detection capabilities. Visualization techniques, such as box plots and scatter plots, also play a key role in manual outlier identification, especially for smaller datasets. Once identified, outliers can be treated through several methods: removal, capping (replacing extreme values with a predefined limit), transformation (applying logarithmic or other transformations to reduce the impact of outliers), or imputation (replacing outliers with estimated values).
Outlier detection and treatment benefits a wide array of applications, including fraud detection in financial transaction data where unusual spending patterns can indicate fraudulent activities, quality control in manufacturing where sensor data outliers might signify equipment malfunction, and clinical trial data cleaning for medical research where anomalous patient responses can skew study results. Other applications include network traffic analysis for cybersecurity and customer behavior analysis in retail datasets. For example, in financial analysis, identifying and treating outliers in transaction data can be crucial for accurate fraud detection. Similarly, in manufacturing, this technique can pinpoint faulty sensors by detecting anomalous readings, ensuring product quality.
However, implementing this data scrubbing technique requires careful consideration of its potential drawbacks. One major risk is the possibility of removing legitimate but rare data points, which can lead to loss of valuable information. Different detection methods might identify different outliers, making it essential to use multiple methods for cross-validation. Determining the appropriate thresholds and treatment methods requires domain expertise. The process can also be computationally intensive for large datasets. Finally, improper treatment methods can introduce bias into the data.
To ensure effective and responsible outlier handling, always investigate outliers before removing them to understand their underlying causes. Employ multiple detection methods for cross-validation and leverage your domain expertise to select the most suitable treatment approach. Documenting your outlier handling decisions is crucial for transparency and reproducibility. Perform sensitivity analysis to understand the impact of outlier treatment on your results and consider maintaining outliers in a separate dataset for future reference. Learn more about Outlier Detection and Treatment Pioneering work by statisticians like John Tukey (inventor of the box plot) and Victor Barnett laid the foundation for modern outlier detection methodologies. Today, libraries like PyOD (Python Outlier Detection) and Scikit-learn's outlier detection modules, along with business intelligence tools like Tableau and Power BI, make outlier detection and treatment more accessible to data professionals across various industries.
This method deserves its place in the list of essential data scrubbing techniques because it directly addresses a common source of data inaccuracies that can significantly impact the reliability of data analysis. By effectively identifying and treating outliers, you enhance the overall quality of your data and strengthen the foundation for informed decision-making. Whether you are a data analyst, business intelligence professional, accountant, or simply a spreadsheet enthusiast working with data, understanding and applying outlier detection and treatment is crucial for ensuring the accuracy and reliability of your insights.
5. Data Imputation: A Crucial Data Scrubbing Technique
Data imputation is a powerful data scrubbing technique that addresses the pervasive problem of missing values in datasets. Instead of discarding incomplete records, which can lead to biased and inaccurate analyses, data imputation replaces these missing values with substituted ones. This approach preserves valuable data, maintains statistical power, and enables more robust analysis. For anyone working with real-world data, from data analysts and business intelligence professionals to accountants dealing with financial records, understanding and applying data imputation is essential.
How Data Imputation Works:
Data imputation leverages various statistical and machine learning methods to estimate plausible values for the missing data. These methods range from simple techniques like using the mean, median, or mode of the existing data to more sophisticated approaches like regression models, k-nearest neighbors (KNN), and even specialized time-series methods for sequential data. The choice of method depends on the nature of the data, the extent of missingness, and the potential impact on downstream analyses.
Features of Data Imputation:
- Statistical Methods: Mean, median, and mode imputation are straightforward techniques for replacing missing values with central tendency measures.
- Regression-Based Imputation: These models predict missing values based on the relationships between variables.
- Multiple Imputation: This advanced technique generates multiple complete datasets, each with different imputed values, reflecting the uncertainty associated with the imputation process. Popularized by Donald Rubin, multiple imputation provides more robust statistical inferences compared to single imputation methods.
-
Machine Learning Approaches: Algorithms like KNN and Random Forest can be adapted for imputation, leveraging patterns in the data to predict missing values. Tools like scikit-learn's
imputemodule facilitate their application. - Time-Series Specific Methods: For sequential data, specialized methods consider the temporal dependencies to impute missing values accurately.
- Hot-deck and Cold-deck Imputation: These methods borrow values from similar records within the same dataset (hot-deck) or from an external dataset (cold-deck).
Pros of Data Imputation:
- Preserves Sample Size and Statistical Power: Imputation retains all available data points, maximizing statistical power and the reliability of analyses. This is crucial for data analysts and business intelligence professionals working with limited datasets.
- Reduces Bias: Complete-case analysis, where records with missing values are discarded, can introduce significant bias. Imputation mitigates this risk.
- Maintains Relationships between Variables: Imputation helps preserve the correlations and dependencies between variables, leading to more accurate and meaningful insights.
- Enables Analysis of Otherwise Incomplete Datasets: Imputation allows you to work with datasets that would be unusable due to missing values, unlocking valuable information for research, business decisions, and financial reporting.
Cons of Data Imputation:
- Risk of Bias: If the imputation model is inappropriate, it can introduce bias into the data.
- Underestimation of Variance: Imputation can lead to underestimation of the true variance and standard errors.
- Artificial Patterns: Incorrectly applied imputation can create spurious patterns in the data.
- Computational Intensity: Complex methods like multiple imputation can be computationally demanding.
Examples of Successful Implementation:
- Government Statistical Agencies: Census bureaus use imputation to handle missing responses in demographic surveys.
- Clinical Research: Imputation is crucial for dealing with missing patient data in clinical trials.
- Climate Studies: Imputation helps reconstruct incomplete weather data for long-term climate analyses.
- Market Research: Imputation allows researchers to analyze consumer survey data with missing responses.
- Industrial Applications: Imputation completes missing sensor data from IoT devices, enabling predictive maintenance and process optimization.
Tips for Effective Data Imputation:
- Understand the Missing Data Mechanism: Determine whether the data is missing completely at random (MCAR), missing at random (MAR), or missing not at random (MNAR). This is crucial for selecting the appropriate imputation method.
- Start Simple: Begin with basic methods like mean imputation before progressing to more complex techniques.
-
Include Uncertainty Measures: When possible, incorporate measures of uncertainty associated with imputed values. Multiple imputation, implemented via tools like R's
micepackage, facilitates this. - Consider Downstream Analyses: Evaluate the potential impact of imputation on subsequent analytical steps.
- Validate Imputation Models: Test the accuracy of your imputation model using known values or hold-out datasets.
- Flag Imputed Values: Maintain transparency by clearly identifying imputed values in your dataset. This is important for accountability and reproducibility.
Data imputation deserves its place in the list of essential data scrubbing techniques because it addresses a fundamental challenge in data analysis: missing data. By effectively handling missing values, data imputation empowers professionals across various fields to extract meaningful insights from incomplete datasets, leading to better decision-making and more accurate analyses. Whether you are a data analyst working with large datasets or a finance professional managing spreadsheets, understanding data imputation is an invaluable skill in today's data-driven world.
6. Data Deduplication
Data deduplication is a crucial data scrubbing technique that identifies and removes duplicate or redundant data entries within a dataset. This process streamlines data storage, enhances processing efficiency, and ensures analytical accuracy by preventing the same information from being counted multiple times. Think of it as cleaning your closet – removing duplicate shirts frees up space and makes it easier to find what you need. Data deduplication does the same for your data, leading to more reliable insights and better decision-making. Deduplication utilizes various matching algorithms to identify records representing the same entity, even with minor variations.
Data deduplication is an essential data scrubbing technique for several reasons. For data analysts and business intelligence professionals, clean, deduplicated data is paramount for accurate reporting and analysis. Accountants and finance teams benefit from improved data integrity, leading to more reliable financial statements. Even for spreadsheet enthusiasts and formula fanatics, removing duplicates simplifies complex spreadsheets and improves formula performance. Whether you're managing customer databases, financial records, or scientific research data, data deduplication plays a vital role in ensuring data quality and efficiency.
This technique employs several methods for identifying duplicates: exact matching for straightforward cases, fuzzy matching algorithms for approximate string matching (e.g., "John Smith" vs. "Jon Smyth"), phonetic matching (Soundex, Metaphone) for name variations, record linkage techniques for cross-database deduplication, hash-based methods for efficient comparison, and even machine learning classifiers for complex entity resolution.
Features and Benefits:
- Reduced Storage Costs: Eliminating redundant data directly translates to lower storage costs and a smaller database footprint.
- Improved Data Quality and Analytical Accuracy: Deduplication ensures a single source of truth, leading to more accurate analyses and reports.
- Enhanced System Performance: Fewer records mean faster processing times for queries and other data operations.
- Cleaner, More Reliable View of Entities: A consolidated view of each entity prevents conflicting information.
Pros and Cons:
- Pros: Reduces storage costs, improves data quality, enhances system performance, provides a cleaner view of entities.
- Cons: Risk of false positives (incorrect merging), risk of false negatives (missed duplicates), computationally expensive for large datasets, requires careful threshold setting for fuzzy matching, may require manual review.
Examples of Successful Implementation:
- Consolidating customer databases after company mergers.
- Managing healthcare patient records across different systems.
- Optimizing mailing lists to prevent multiple mailings to the same person.
- Deduplicating research papers in scientific citation databases.
- Managing product catalogs in e-commerce platforms.
Actionable Tips:
- Standardize before matching: Normalize case (e.g., convert all to uppercase), standardize formats (dates, addresses).
- Use blocking or indexing: Reduce the comparison space for improved efficiency.
- Multi-pass approach: Implement multiple passes with different matching criteria.
- Master Data Management: Maintain an ongoing strategy for deduplication.
- Golden Record Strategy: Establish a process for creating a single, authoritative record for each entity.
- Human-in-the-loop: Consider manual verification for critical data.
Learn more about Data Deduplication
By implementing data deduplication effectively, organizations can significantly improve data quality, reduce storage costs, and enhance overall operational efficiency. This technique holds immense value for anyone working with data, making it a vital component of the data scrubbing process.
7. Natural Language Processing (NLP) for Text Normalization
Natural Language Processing (NLP) for text normalization is a powerful data scrubbing technique that leverages linguistic algorithms to standardize and clean unstructured textual data. This process transforms raw text into a consistent and analyzable format, making it suitable for various data-driven tasks. Why does this deserve a spot on our list of top data scrubbing techniques? Because in today's data-rich world, a significant portion of valuable information resides in unstructured text formats like user-generated content, survey responses, customer feedback, and document collections. NLP unlocks the potential of this data, transforming it into actionable insights.
So how does it work? NLP applies a series of operations to achieve text normalization:
- Tokenization: Breaks down text into individual words or phrases (tokens) for analysis.
- Stemming and Lemmatization: Reduces words to their root or base forms (e.g., "running" becomes "run"). Lemmatization is generally preferred as it considers the context and produces a valid dictionary word, unlike stemming.
- Stop Word Removal: Filters out common words like "the," "a," and "is" that typically don't carry significant meaning in analysis.
- Named Entity Recognition (NER): Identifies and classifies named entities like people, organizations, locations, and dates.
- Part-of-Speech Tagging: Assigns grammatical tags (e.g., noun, verb, adjective) to each word, aiding in understanding sentence structure.
- Spelling Correction and Text Normalization: Corrects spelling errors and standardizes variations in text (e.g., converting abbreviations, handling different capitalization).
- Sentiment Analysis: Determines the emotional tone expressed in the text (positive, negative, or neutral).
Learn more about Natural Language Processing (NLP) for Text Normalization
Features and Benefits: NLP provides a comprehensive toolkit for text processing. Its features offer several benefits:
- Quantitative Analysis: Makes unstructured text suitable for quantitative analysis and statistical modeling.
- Dimensionality Reduction: Reduces the complexity and dimensionality of text data by eliminating noise and redundancy.
- Consistent Search and Retrieval: Enables consistent search and retrieval by standardizing text representations.
- Improved Machine Learning: Improves the accuracy and efficiency of text-based machine learning models.
- Multilingual Support: Handles multilingual content through language-specific models and resources.
- Information Extraction: Extracts structured information from free text, enabling the creation of knowledge bases.
Pros and Cons:
Pros:
- Transforms unstructured text data into a usable format for analysis.
- Improves data quality and consistency.
- Enables deeper insights from textual information.
Cons:
- Potential loss of semantic nuance during aggressive normalization.
- Computationally intensive, especially for large datasets.
- Can encounter language and domain-specific challenges.
- Requires specialized libraries, models, and potentially training data.
Examples of Successful Implementation:
- Social media sentiment analysis platforms for brand monitoring.
- Customer feedback classification systems for identifying key themes.
- Legal document processing and contract analysis for automated review.
- Medical records text mining for research and insights.
- News article categorization and trend analysis for understanding public opinion.
- Chatbot training data preparation for improved conversational AI.
Actionable Tips for Implementation:
- Choose appropriate NLP libraries based on language and project requirements. For Python, consider exploring its rich NLP ecosystem. For more advanced text normalization and analysis, explore Python's powerful NLP libraries. how to use Python for NLP (Source: How to Use Python for NLP and Semantic SEO: Expert Tips from Outrank)
- Use domain-specific dictionaries and stop word lists for better results.
- Strike a balance between aggressive normalization and meaning preservation.
- Evaluate results with domain experts to ensure accuracy and relevance.
- Preserve original text alongside normalized versions for reference.
- Leverage pre-trained models when available; fine-tune when necessary for specific domains.
By understanding the capabilities and limitations of NLP, data professionals can effectively apply this powerful technique to unlock the valuable insights hidden within unstructured textual data, improving data quality and driving informed decision-making.
Data Scrubbing Techniques Comparison
| Technique | Implementation Complexity 🔄 | Resource Requirements ⚡ | Expected Outcomes 📊 | Ideal Use Cases 💡 | Key Advantages ⭐ |
|---|---|---|---|---|---|
| Regular Expression (Regex) Data Cleaning | Moderate to high due to complex syntax and debugging | Low to moderate; lightweight, no external libs needed | Accurate pattern-based text cleaning and validation | Text format validation, log parsing, data migration | Highly flexible, efficient for repetitive tasks |
| ETL (Extract, Transform, Load) Processing | High; involves complex pipelines and integration | High; may require dedicated infrastructure and tools | Comprehensive, consistent, and clean enterprise data | Enterprise data integration, batch/real-time pipelines | Scalable, supports heterogeneous data sources |
| Data Normalization | Moderate; depends on data types and chosen methods | Low to moderate; mostly compute-focused | Consistent scaled data and reduced redundancy | Machine learning preprocessing, database design | Improves model performance and analytical accuracy |
| Outlier Detection and Treatment | Moderate to high; requires statistical or ML methods | Moderate to high; may be compute-intensive | Improved data quality and model robustness | Fraud detection, sensor data cleaning, medical data | Enhances accuracy by handling anomalies |
| Data Imputation | Moderate; from simple stats to complex ML models | Moderate; depends on complexity of methods | Maintains dataset completeness and statistical validity | Handling missing data in surveys, IoT, clinical data | Preserves sample size and reduces bias |
| Data Deduplication | Moderate to high; complex matching and record linkage | Moderate to high; computationally expensive | Reduced redundancy and improved data quality | Customer databases, healthcare records, product catalogs | Reduces storage and improves system performance |
| NLP for Text Normalization | High; requires specialized NLP libraries and models | High; computationally intensive | Structured, consistent text ready for analysis | Social media analysis, legal docs, chatbot training | Handles unstructured text and extracts insights |
Level Up Your Data Game
Mastering data scrubbing techniques is essential for anyone working with data, from seasoned data analysts to spreadsheet enthusiasts. We've explored seven key techniques in this article: using regular expressions (regex) for precise cleaning, implementing ETL processes for structured transformations, normalizing data for consistency, detecting and treating outliers, imputing missing values, deduplicating records, and leveraging natural language processing (NLP) for text normalization. By understanding and applying these data scrubbing techniques, you'll ensure your data is accurate, reliable, and ready for analysis. This translates to better decision-making, more accurate reporting, and ultimately, more successful data-driven projects. Clean data isn't just a nice-to-have; it's the foundation for meaningful insights that drive real-world impact.
Ready to celebrate your newfound data prowess and equip yourself for data cleaning success? Head over to SumproductAddict for a unique collection of Excel gear and accessories designed for the data enthusiast. Surround yourself with tools and inspiration that reflect your passion for clean, efficient, and powerful data analysis.