
Automate Data Analysis for Faster Business Insights
Why Data Analysis Automation Is No Longer Optional

The amount of data available to businesses today is immense. Manual analysis, once a reasonable task, now feels impossible. Organizations relying on outdated manual processes are overwhelmed, struggling to find valuable insights within the flood of information. This struggle puts them at a significant disadvantage in today's competitive landscape.
But there's a smarter approach. Progressive businesses are adopting data analysis automation, transforming week-long projects into tasks completed in mere minutes. This isn't just about time savings; it's about unlocking the full potential of data to make better decisions and achieve real business results.
For example, imagine a marketing team instantly identifying emerging customer trends and adjusting campaigns in real time, instead of waiting weeks for manual reports. This is the agility that automation provides.
Bridging the Skills Gap With Automation
A key benefit of automating data analysis is its ability to address the growing analytics skills gap. Finding and retaining skilled data analysts is a challenge for many organizations. Automation empowers non-technical team members to perform complex analyses without needing advanced coding skills.
This democratization of data access makes insights available across the organization, fostering a more data-driven culture. It also frees up skilled analysts to focus on more strategic initiatives, maximizing their business impact. You might be interested in: How to master...
The Growth of Data Analytics and AI
The global data analytics market is growing rapidly, driven by advancements in technologies like AI, machine learning, and cloud computing. Projections indicate a 30.08% Compound Annual Growth Rate (CAGR) between 2016 and 2026, with the market expected to reach $132.9 billion by 2026.
By 2025, nearly 65% of organizations are expected to have adopted or be actively exploring AI for data and analytics. This underscores AI's potential to automate critical data processing tasks like anomaly detection and predictive maintenance. AI-powered forecasting also helps businesses anticipate market shifts and customer behavior more accurately, leading to more informed strategic decisions. Find more detailed statistics here.
The Competitive Edge of Automated Data Analysis
This move toward automation isn't just a technological trend; it's a fundamental shift in how businesses operate. Companies embracing data analysis automation gain a significant competitive edge.
They can react faster to market changes, identify new opportunities, and optimize their operations with greater precision. This efficiency and agility are becoming crucial for success in today's dynamic business environment. Automating data analysis isn't just about keeping up; it's about moving ahead.
Breaking Down the Tech That's Changing Everything
The world of data analysis is constantly evolving. Artificial intelligence (AI) and machine learning (ML) are now practical tools transforming how we understand data. These technologies empower us to move beyond manual data processing and uncover strategic insights with less human intervention.
For instance, AI algorithms can identify patterns and anomalies in large datasets much faster and more accurately than human analysts. This creates new opportunities for businesses to make informed, data-driven decisions.
The Power of Automated Insights
AI and ML are at the heart of automating data analysis. Machine learning models can be trained to handle repetitive analytical tasks, allowing human analysts to focus on more strategic work. This automation also reduces the risk of human error, ensuring more accurate and dependable results.
This means businesses can process data efficiently, quickly identify important trends, and ultimately, make better decisions. When considering broader applications, think about strategies to automate customer service and optimize processes.
From Data to Decisions: NLP and RPA
Natural language processing (NLP) makes data access easier for everyone. NLP enables users to interact with data using everyday language. They can ask questions in plain English and receive clear answers without writing complex code.
Robotic process automation (RPA) eliminates tedious manual data entry. This saves time, reduces errors, and improves data quality. Learn more from our article on How to master...
The Cloud: Foundation for Automation
Cloud infrastructure plays a vital role in supporting these technologies. The cloud provides the scalability and processing power needed for massive datasets and complex analytical procedures. It also offers cost-effective storage and access to advanced analytical tools.
The growth of cloud computing has significantly enabled the automation of data analysis, especially within AI and ML. By 2025, over 65% of organizations plan to increase their AI investments for data processes. This demonstrates the growing dependence on AI-powered tools for managing large amounts of data with speed and accuracy.
AI-based automation is reshaping data ingestion, extract, transform, load (ETL) processes, and data governance. Traditional manual management is giving way to automated systems. This shift allows companies to prioritize innovation over infrastructure, leading to better data quality and functionality. For example, automated code generation minimizes human coding errors, creating robust data pipelines crucial for AI applications. You can explore this topic further here. These combined technologies offer flexible solutions that adapt to evolving business requirements.
Your Roadmap to Automated Analysis Success
Successfully automating data analysis isn't about chasing the newest tools. It's about developing a solid strategy. This proven implementation framework, built on the successes of other organizations, will guide you through the process. It focuses on connecting your business goals with the power of automated analysis, examining your existing data, and selecting tools that meet your specific needs, not just the latest trends.
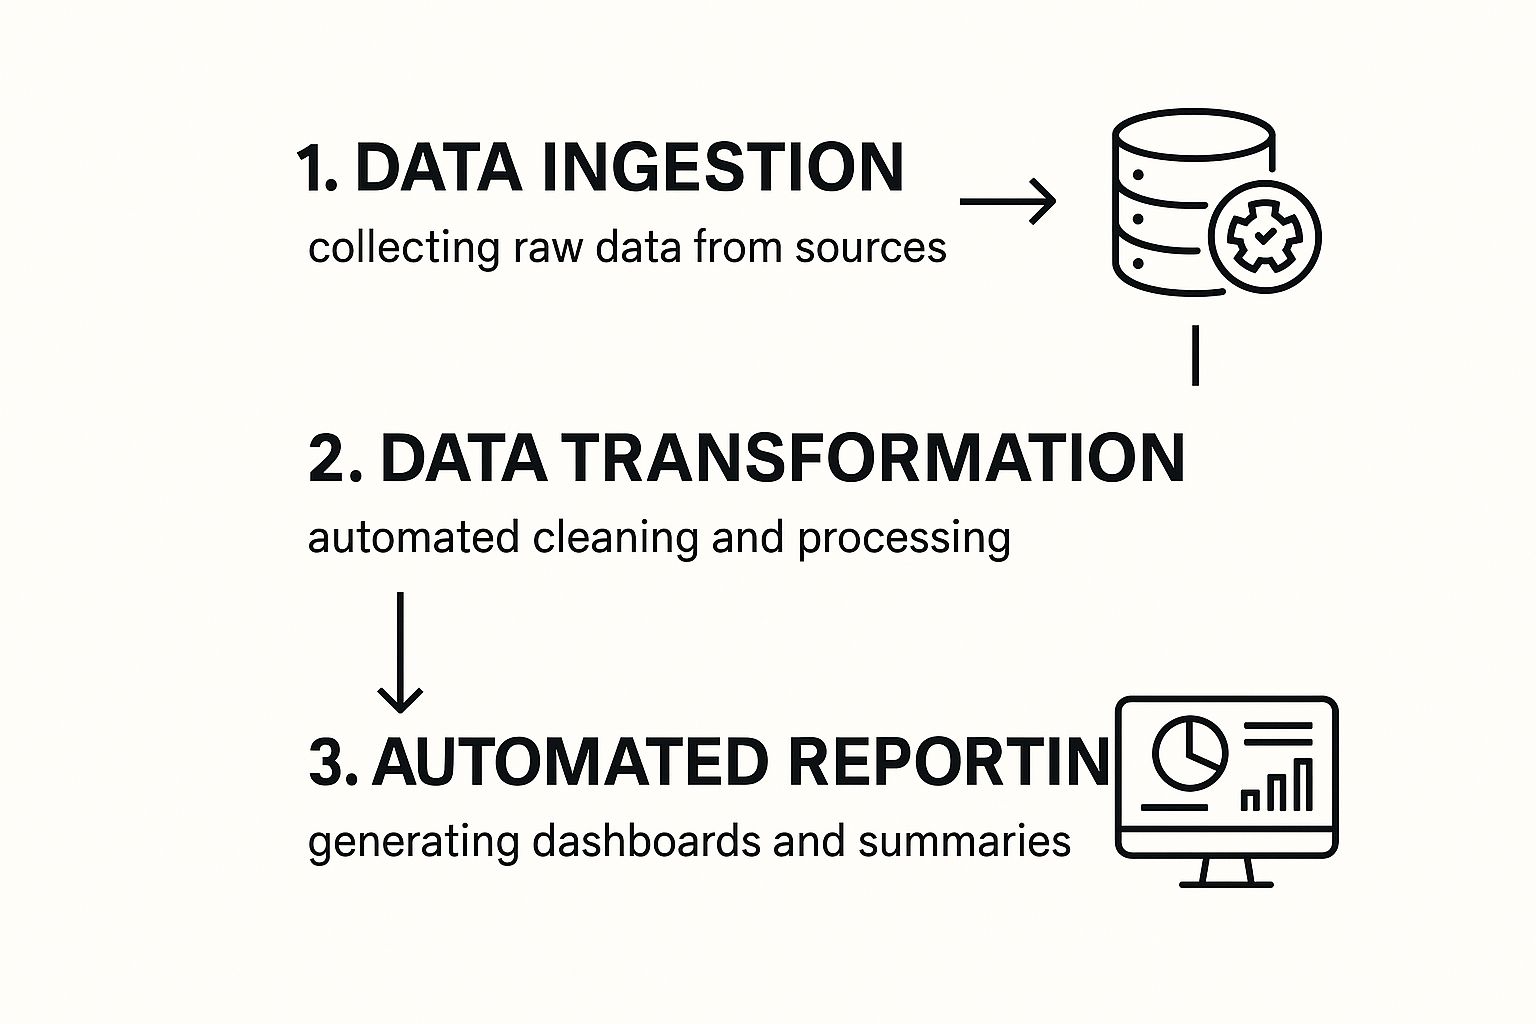
This infographic shows the main steps in automated data analysis: data ingestion, transformation, and automated reporting. It illustrates how data flows from raw collection to refined insights, highlighting how each stage connects. Automating these steps leads to efficient data processing and the creation of valuable reports.
Defining Clear Business Objectives
First, identify your business goals. What problems are you trying to address with automated analysis? Are you hoping to improve forecasting accuracy, uncover cost savings, or make your marketing campaigns more effective? Well-defined objectives form the basis of your automation strategy.
Next, evaluate your current data setup. What data sources do you have? Are there gaps in how you collect data? Understanding your data landscape reveals areas where automation can be most impactful. Read also: How to master...
Selecting the Right Tools
Choosing the right tools is essential for success. Avoid getting caught up in industry hype. Concentrate on tools that match your specific needs and technical skills. Consider factors like ease of use, how well they integrate with your current systems, and overall cost.
Incremental Implementation for Quick Wins
Implementing automated analysis should be a gradual process. Begin with smaller, manageable projects that can show quick results. This creates momentum and encourages support from stakeholders.
For example, automating a single report that used to require significant manual work can immediately demonstrate the value of automation. This early success sets the stage for more complex implementations later on.
The following table outlines the phases of implementing automated data analysis. It provides a structured approach to guide your organization through the process, from initial assessment and planning to full deployment and ongoing optimization.
Data Analysis Automation Implementation Phases: A structured approach to implementing automated data analysis across your organization
| Phase | Key Activities | Expected Outcomes | Timeline | Potential Challenges |
|---|---|---|---|---|
| Assessment and Planning | Define business objectives, assess current data landscape, identify automation opportunities | Clear roadmap and prioritized automation projects | 1-2 months | Lack of clear business objectives, resistance to change |
| Tool Selection and Setup | Evaluate and select appropriate tools, configure and integrate with existing systems | Functional automation tools ready for implementation | 2-3 months | Difficulty integrating with existing systems, inadequate training on new tools |
| Pilot Implementation | Automate a small-scale project, test and refine processes | Proof of concept and initial success stories | 1-2 months | Unexpected data issues, resistance from end-users |
| Full Deployment | Roll out automation to wider areas of the organization, train and support users | Improved efficiency and data-driven decision-making | 3-6 months | Scaling challenges, data quality issues, lack of user adoption |
| Ongoing Optimization | Monitor performance, identify areas for improvement, refine automation processes | Continuous improvement and maximized ROI | Ongoing | Maintaining data quality, adapting to changing business needs |
This table illustrates the key phases, activities, and outcomes of a successful automation implementation. It also highlights potential challenges to be aware of during each phase.
Addressing Challenges and Driving Adoption
There will be challenges. It’s important to address concerns about data governance and potential resistance from analysts who worry about their roles changing. Practical solutions, such as involving analysts in the automation process and showing how automation can improve their work, are key to encouraging adoption across different departments.
This step-by-step approach allows your team to learn and adapt, eventually building comprehensive automated analysis capabilities that deliver significant, long-term value.
How Leading Industries Automate Data Analysis
Automating data analysis offers unique advantages across diverse industries, each facing its own set of challenges and opportunities. Let's explore how specific sectors leverage automation for tangible results.
Healthcare: Real-Time Patient Monitoring
In healthcare, automated analysis empowers real-time patient monitoring systems. These systems can predict potential health complications hours or even days before traditional methods. This proactive approach allows for earlier medical interventions, potentially saving lives and improving patient outcomes.
Automated systems analyze vital signs, lab results, and other patient data to identify subtle changes that might indicate a developing infection or other complications. This early warning provides medical professionals with crucial time to implement preventative measures.
Retail: Optimizing Inventory Management
Retail businesses use automated inventory analysis to fine-tune operations, reducing carrying costs while ensuring product availability for customers. Maintaining this balance is vital for profitability and customer satisfaction.
Automated systems analyze sales data, supply chain information, and even external factors like weather patterns to predict demand and optimize inventory levels. This prevents overstocking, which ties up capital, and understocking, which leads to lost sales. You might be interested in: Learn more in our article about How to master...
Manufacturing: Predictive Maintenance
In manufacturing, automated analysis enables predictive maintenance, identifying potential equipment failures before they happen. This proactive approach minimizes downtime, reduces repair costs, and extends the lifespan of machinery. If you're looking for ways to visualize your automation journey, check out this article: How To Create A Roadmap Website With Notion.
Automated systems analyze sensor data from machines to detect anomalies and predict when maintenance is required. This allows manufacturers to schedule maintenance proactively, minimizing disruptions to production.
Financial Services: Automating Compliance
Financial services organizations increasingly rely on automated compliance monitoring to manage risk more effectively. The financial sector is experiencing significant efficiency improvements and cost reductions through automated data analysis. The global financial automation market, valued at $8.1 billion in 2024, is projected to reach $18.4 billion by 2030, demonstrating a 14.6% CAGR. Learn more here.
Cloud-based automation systems and the increasing importance of data-driven decisions are key drivers of this growth. Automated tools streamline operations such as loan processing, fraud detection, and customer onboarding, resulting in faster service and reduced operational risks. This underscores the critical role of automation in meeting regulatory requirements and promoting innovation in finance.
These examples showcase the versatile applications of automated data analysis across various industries. Each sector benefits from faster insights, increased efficiency, and more informed decision-making. This results in cost savings, improved risk management, and a stronger competitive advantage.
The Tools That Actually Deliver on Their Promises

Sifting through the multitude of data analysis automation tools can be daunting. This section offers a practical look at the tools that truly live up to their hype, based on real-world use and user experiences. We'll explore their strengths, implementation needs, and pricing, emphasizing practical value over marketing jargon.
Data Integration Platforms: Reducing the Engineering Burden
Data integration platforms are key to automating data analysis. These tools bring together data from different sources, preparing it for analysis. Features like automated data cleaning and transformation significantly lighten the load for engineers.
However, implementation can come with unexpected costs. Factors such as training, maintenance, and the need for specialized technical skills can impact the overall expense.
Visualization Tools With Automation: Empowering Business Users
Visualization tools with automation empower business users to uncover insights without writing code. Automated reports and interactive dashboards make data exploration accessible.
This allows non-technical teams to base decisions on data, fostering a data-driven culture across the organization. However, it's essential to be aware of the limitations of no-code solutions. Some complex analyses might still require technical expertise.
No-Code vs. Expert-Driven Automation: Finding the Right Balance
No-code platforms are becoming increasingly popular, democratizing access to data analysis automation. These tools enable business users to build automated workflows without coding.
However, some tasks aren't easily simplified. Complex data manipulation or advanced statistical modeling often still require the skills of data scientists or engineers. Striking the right balance between no-code solutions and expert-driven automation is essential.
Choosing the Right Tools: Features, Costs, and Implementation
Choosing the right tools demands careful thought. Beyond the core features, consider implementation needs and possible hidden costs. Realistic pricing expectations are also vital for effective budgeting.
The table below compares leading data analysis automation tools. It highlights their primary functions, required technical skills, integration options, and typical pricing models.
To help you choose the best tool for your needs, we've put together a comparison table. It details each tool's core capabilities, ease of use, and cost.
Comparison of Top Data Analysis Automation Tools: Evaluate leading tools based on key capabilities, ease of use, and pricing models.
| Tool | Primary Function | Technical Expertise Required | Integration Capabilities | Pricing Model | Best For |
|---|---|---|---|---|---|
| Tool A | Data Integration & ETL | Moderate | Extensive API connections | Subscription-based, tiered pricing | Organizations with complex data pipelines |
| Tool B | Automated Reporting & Visualization | Low | Pre-built connectors for common data sources | Per-user monthly licensing | Business users seeking self-service analytics |
| Tool C | Advanced Statistical Modeling & Machine Learning | High | Supports custom code and integration with development environments | Usage-based pricing, dependent on computing resources | Data scientists and advanced analytics teams |
| Tool D | No-Code Workflow Automation | Low | Limited integrations, primarily focused on internal data sources | Fixed monthly fee with optional add-ons | Small to medium businesses with basic automation needs |
This comparison offers a solid starting point for evaluating potential tools. A detailed assessment of specific business needs is always recommended before making a final decision. Seamless integration with your current workflow is crucial. Also, consider the vendor's support. Responsive support can be invaluable during implementation and ongoing use.
Proving the Value of Your Automation Investment
Demonstrating a solid return on investment (ROI) from automating your data analysis requires more than just general statements. You need to show the tangible impact on your business. This section explores how to effectively measure the value of automation initiatives, focusing on specific metrics that highlight real improvements.
Establishing Meaningful Baselines
Before automating anything, establish clear baselines. How long do your current processes take? What's the error rate in manual reporting? How often are decisions delayed because of data bottlenecks? These initial metrics will serve as your comparison point for measuring the impact of automation.
For example, if creating a weekly sales report manually currently takes 15 hours, that's your baseline for measuring time saved once you've automated the process.
Setting Realistic Targets
Define achievable targets that align with your business goals. If your goal is to reduce report generation time, set a specific percentage improvement as your target. If you're aiming for improved decision-making, quantify that improvement as well.
For instance, aim to reduce report generation time by 50%, or aim to increase the frequency of data-driven decisions by 25%. These specific, measurable targets help track progress and prove automation's effectiveness.
Measuring Efficiency and Accuracy
Focus on metrics that showcase real value. Track hours saved compared to manual processes. Measure improvements in decision quality and data accuracy. Also, be sure to quantify the impact on overall business outcomes.
Don't forget to monitor error rates. Automating processes often drastically reduces errors that are common in manual data handling. This improved accuracy means more reliable insights and, ultimately, better decisions.
Communicating ROI to Stakeholders
Develop clear, concise reports to demonstrate ROI to different audiences. Technical teams will be interested in the implementation details. Executives, on the other hand, are more interested in the bottom-line impact. Tailor your reports to their specific concerns.
This means presenting technical metrics alongside their effects on business goals. Show how time saved translates to reduced labor costs. Demonstrate how improved accuracy leads to better forecasting and increased revenue. You might also find this helpful: Check out our guide on How to master...
Measuring Long-Term Strategic Advantages
Don't just focus on the short-term gains. Automation offers long-term strategic benefits as well. Faster data analysis enables you to respond more quickly to market changes, making your business more agile. Improved forecasting accuracy leads to better-informed strategic planning.
These long-term advantages are often more difficult to quantify but are just as crucial when evaluating the overall value of your automation investment.
By establishing clear baselines, setting achievable targets, and tracking meaningful metrics, you can effectively prove the value of your investment in automating data analysis. This justifies the initial investment and paves the way for future automation initiatives.
Ready to enhance your data analysis skills and showcase your spreadsheet expertise? Explore SumproductAddict's exclusive collection of Excel-themed gear, from witty t-shirts to practical desk accessories, designed specifically for data professionals. Visit SumproductAddict today and use code FIRST10 for a 10% discount on your first order!