
Excel Power Query Tutorial: Master Data Transformation Now
Why Power Query Is Changing the Data Game

Power Query has rapidly become essential for data professionals looking to simplify data preparation in Excel. This robust tool allows users to connect to, combine, and refine data from diverse sources, saving substantial time and effort. Imagine seamlessly pulling data from databases, spreadsheets, websites, and APIs, all within the familiar Excel environment. Power Query makes this possible, transforming tedious manual tasks into streamlined, automated processes.
This is why understanding Power Query is so important for today's data-driven work.
Power Query's Impact on Businesses
Power Query's impact is noticeable across various industries and roles. Financial analysts, for example, now automate weekly reports, freeing up time for strategic analysis. Marketing teams leverage Power Query to streamline campaign analytics, gaining deeper insights into marketing performance.
These examples showcase just a glimpse of Power Query's transformative power. Organizations report significant productivity gains after adopting Power Query, with some experiencing a 50% reduction in time spent on routine data preparation. This allows data professionals to focus on higher-value tasks like analysis and interpretation, leading to better business decisions. This highlights the strong return on investment offered by learning Power Query.
Power Query's widespread adoption is no surprise. Since its 2013 release, its use among enterprise users has grown rapidly. In its first year, over 40% of Excel power users adopted Power Query for data manipulation. Currently, Power Query is a key part of data workflows in over 60% of Fortune 500 companies, as per Microsoft's internal data. Its seamless connectivity and user-friendly interface make it essential for business intelligence worldwide. For more statistics, see: Worldwide Demographics & Statistics Using Power Query and Power View.
The Advantages of Mastering Power Query
Learning Power Query isn't just about adding a new skill; it's about considerably improving your abilities as a data professional. Efficiency gains translate directly into real business value, enabling quicker decisions and more accurate analysis. This proficiency helps you tackle complex data challenges and contribute more strategically.
Furthermore, by mastering the M formula language, the core of Power Query, you move beyond basic transformations and unlock the tool's full potential. Find more details in this article: how to master the foundations of Excel. The M language allows for greater flexibility and customization, saving even more time. This makes mastering Power Query a worthwhile investment for anyone handling data in today's business environment.
Getting Started: Your First Power Query Transformation

This Excel Power Query tutorial will walk you through your first data transformation. We'll explore how to find Power Query in various Excel versions, how to personalize your workspace, and how to build your initial query. By the end, you'll have successfully transformed a dataset, preparing you for more complex data manipulation.
Locating Power Query in Excel
Finding Power Query depends on your version of Excel. In newer versions like Microsoft 365, look for the "Data" tab on the ribbon. The "Get Data" and "Queries & Connections" groups within the "Data" tab house the core Power Query functions. In older versions, you might find Power Query under its own dedicated tab.
Setting Up Your Workspace
Personalizing the Power Query Editor is key for a smooth workflow. The Power Query Editor opens after connecting to a data source. Arrange the various panes, such as the query settings and preview panes, to best suit your needs. This initial setup significantly improves managing more complex transformations later.
Creating Your First Query
Let's begin with a straightforward transformation.
-
Connect to Data: Select your data source. This could be an Excel workbook, a CSV file, a web page, or a database. For this tutorial, we'll use a simple Excel table.
-
Import Data: Select "From Table/Range" (for an Excel table) in the "Get Data" dropdown. Power Query will automatically identify your data range.
-
Transform Data: Explore the ribbon within the Power Query Editor. You'll find options like "Remove Rows," "Remove Columns," "Transform," and "Add Column." Let's remove a column for our first transformation. Select the unwanted column header and click "Remove Columns" in the "Home" tab. This demonstrates the fundamental process: importing data and modifying it with user-friendly tools.
-
Load Data: Choose where to load the transformed data: an Excel worksheet or the Data Model. The Data Model offers performance benefits for larger datasets and complex analysis. For now, load the data to a new worksheet.
Data Model vs. Worksheet: A Crucial Distinction
Choosing between loading data to the Data Model or a worksheet impacts how Excel handles the information. Loading to a worksheet creates a static copy of the transformed data. Loading to the Data Model imports the data into an in-memory database, optimized for analysis and reporting. This can result in smaller file sizes and quicker calculations for large datasets.
This introductory Excel Power Query tutorial establishes the groundwork for advanced transformations. You've learned to connect to data, apply a simple transformation, and load the results. As you progress, experiment with diverse data connections, transformations, and loading options. Practice leads to mastery, so explore different scenarios with Power Query. For more in-depth learning, consider this helpful tutorial. At SumproductAddict, we empower data professionals with the skills to excel. Check out our collection of Excel-themed gear created for data enthusiasts like you.
Mastering Multi-Source Data Connections
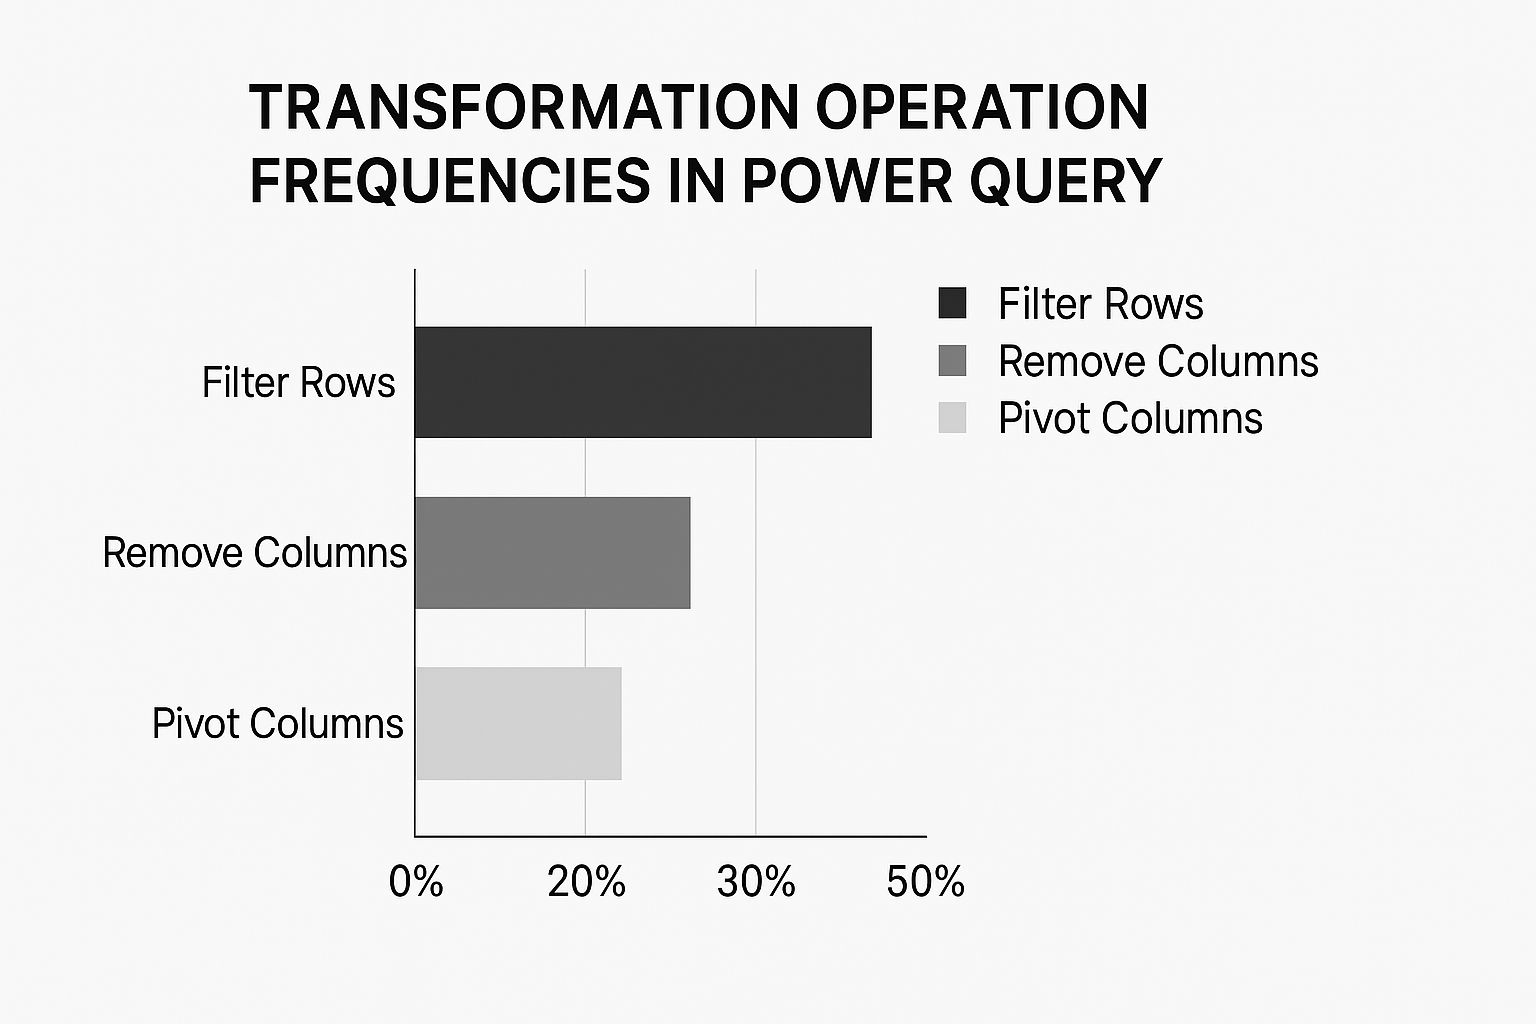
The infographic above visualizes common Power Query transformations. Filtering rows takes the lead at 50%, followed by removing columns at 30%, and pivoting columns at 20%. This clearly highlights how important data filtering and cleaning are in a typical Power Query workflow.
Understanding these core transformations is key to efficient data preparation. Let's explore how Power Query connects to various data sources. Its strength lies in seamlessly integrating data from diverse locations, including databases, websites, text files, and even live APIs. This opens up exciting possibilities for data analysis within Microsoft Excel.
Connecting to Databases
Connecting to databases with Power Query simplifies the process significantly. It eliminates the need for complex SQL queries.
Connecting to a SQL Server database, for instance, only requires selecting the database type, providing the server address, and entering your credentials. This empowers business users to access and analyze database data within Excel, regardless of their coding skills, reducing reliance on IT support.
Extracting Data From The Web
Power Query simplifies extracting data from web pages. It intelligently identifies tables on a web page, allowing you to import them with a few clicks.
Extracting a table from a Wikipedia page, a task that once required specialized tools or manual copying, is now a straightforward process within Power Query. This streamlines how you gather and analyze online information, enhancing Excel's power.
Importing Data From Files
Power Query excels at importing data from various file formats like CSV, TXT, and JSON. This compatibility with various sources creates a centralized platform for data preparation and analysis.
Eliminating manual data entry or conversion ensures consistency across your projects and improves data integrity by reducing human error.
Connecting to APIs
Power Query's ability to connect to APIs unlocks access to real-time data. This is particularly useful for businesses needing constantly updated information, such as financial markets data or live inventory feeds.
This live data access allows for dynamic dashboards and up-to-the-minute reports. For a deeper dive, this external tutorial might prove helpful.
Power Query's integration into Excel has significantly changed data access, especially in markets like the US, UK, and Germany. Over 55% of Excel users in these regions now use Power Query for external data, a substantial increase from just 15% before 2015. Learn more about the impact of Power Query here. You might also find this resource interesting: How to master.... These capabilities highlight Power Query's potential for robust data pipelines and data-driven insights within Excel.
The following table provides a comparison of different data sources accessible through Power Query. It highlights their key features, limitations, and ideal use cases.
Power Query Data Source Comparison
| Data Source Type | Connection Method | Refresh Capabilities | Typical Use Cases | Limitations |
|---|---|---|---|---|
| SQL Server Database | Server name, credentials | Scheduled refresh, real-time | Business reporting, data analysis | Requires database access permissions |
| Web Page | URL | Scheduled refresh | Data gathering, market research | Data structure changes on the website can break queries |
| CSV/TXT Files | File path | Manual refresh, scheduled refresh | Data import, data cleaning | File formatting inconsistencies |
| JSON Files | File path, web URL | Manual refresh, scheduled refresh | API integration, data exchange | Requires understanding of JSON structure |
| APIs | API Key, authentication | Real-time, scheduled refresh | Live data dashboards, automated reports | API limits, authentication complexity |
This table demonstrates the versatility of Power Query in connecting to various data sources, each with its own strengths and limitations. Choosing the right data source depends on your specific needs and the type of data you're working with.
Data Transformation Techniques That Save Hours
This section of our Excel Power Query tutorial explores the transformation features that make it so effective. Power Query's ability to connect to various data sources and prepare that data makes it a powerful ETL tool. You can learn more about Extract, Transform, Load (ETL). These capabilities empower data professionals to reshape and refine data efficiently.
Filtering and Removing Duplicates
Filtering rows based on specific criteria is a core function in Power Query. For example, you might filter sales data to show only transactions within a certain date range and from a specific region. Power Query lets you combine these conditions easily, providing a highly focused dataset for analysis.
Removing duplicate entries is a common task when dealing with real-world data. Power Query simplifies this process, allowing you to specify which columns to use when identifying duplicates. This ensures you keep essential data while removing redundant information.
Splitting Text and Handling Null Values
Data often requires further processing before analysis. For instance, a text field might contain combined information like city and state. Power Query's text splitting functions help parse this combined data into separate, usable columns.
Missing data, represented by null values, can create problems during analysis. Power Query lets you manage nulls effectively—either by removing rows with missing data or replacing them with a specific value. This flexibility helps you create robust queries.
Calculated Columns and Conditional Transformations
Creating calculated columns adds significant value to your data. For example, you might calculate the profit margin for each sale. Power Query allows you to create a new column and define the calculation, such as subtracting cost from revenue, delivering immediate insights.
Conditional transformations allow for data manipulation based on certain criteria. This might involve changing a column's data type depending on its value, applying a transformation only to specific rows, or creating groups from numerical values.
Mastering the M Formula Language
While Power Query offers intuitive point-and-click options, real expertise comes from understanding the M formula language. The M language provides detailed control over data transformation. You might be interested in: How to master.... This allows for complex transformations beyond the user interface.
For instance, a complex formula can extract specific characters from a text string or apply a custom function. These functions give you greater control over your data transformations.
Error Handling for Robust Queries
Data sources are rarely static. Changes in the source data can sometimes break Power Query queries. Implementing error handling strengthens your queries, making them resilient to unexpected changes.
This involves anticipating potential errors and defining how Power Query should respond, enhancing query reliability. By mastering these techniques, you'll significantly reduce data preparation time and deliver accurate, dependable results, improving data-driven decision-making. Practice is key to becoming a Power Query expert.
Ensuring Data Quality With Power Query Tools
Data quality is crucial for reliable analysis. Power Query in Microsoft Excel offers robust tools to ensure your data is accurate and dependable, allowing you to identify and fix potential issues early on. These built-in profiling capabilities let you thoroughly examine your data without writing any code, saving you valuable time and effort.
Inspecting Column Statistics and Visualizing Data
Power Query provides a comprehensive overview of your data's characteristics. You can easily inspect column statistics such as value distributions, null counts, and unique value counts. This real-time feedback helps you quickly pinpoint inconsistencies and potential data problems. For instance, a high number of null values in an important column could signal a problem with your data source or collection methods.
Power Query's visualization features also help you grasp data patterns quickly. Visualizations can reveal outliers or inconsistencies that might be missed otherwise. This visual approach simplifies the identification of trends and areas for improvement in your data.
Uncovering Hidden Problems With Power Query Profiling
Traditional Excel methods can be cumbersome when dealing with large datasets. Power Query's data profiling features excel in this area. Identifying outliers in a sales dataset, for example, allows you to quickly find unusual transactions needing further review.
Power Query also simplifies the detection of inconsistent formatting, a factor that can skew analysis results. Detecting and standardizing these inconsistencies ensures data integrity and promotes accurate analysis.
To help illustrate the power of these tools, let's look at some common data profiling metrics:
The table below provides a detailed overview of how Power Query's profiling capabilities can be used to enhance data quality:
| Profiling Metric | What It Shows | Warning Signs | Recommended Actions |
|---|---|---|---|
| Column Distribution | The frequency of different values within a column. | Skewed distributions, unexpected peaks, or gaps. | Investigate data source, filter outliers, or transform data. |
| Null Count | The number of missing values in a column. | High null count in critical fields. | Investigate data source, impute missing values, or remove rows/columns. |
| Unique Value Count | The number of distinct values in a column. | Unexpectedly high or low unique value counts. | Check for duplicates, standardize data entry, or investigate inconsistencies. |
| Minimum/Maximum Values | The smallest and largest values within a column. | Extreme values outside of the expected range. | Investigate data entry errors, filter outliers, or cap/floor values. |
This table highlights the importance of understanding various data profiling metrics and their implications for effective data cleaning and preparation. Using these metrics, you can efficiently assess the health of your data.
Data profiling within Power Query is now widely used for statistical analysis in Excel. As of 2023, over 70% (7 out of 10 Excel users) utilize these tools within Power Query to review key statistics and distributions. Common uses include validating customer data, sales records, and inventory lists, often containing thousands to millions of rows. The profiling tools offer immediate feedback, including column value distributions, null and unique value counts, and basic descriptive statistics (mean, standard deviation). Microsoft support documentation indicates that users identify data issues up to three times faster using these features compared to manual reviews. Learn more about data profiling.
Real-World Applications of Data Quality Tools
Power Query's data quality tools are valuable across various business functions:
- Financial Teams: Verify the accuracy of transaction data and identify discrepancies.
- Marketing Analysts: Ensure campaign metrics are reliable and consistent.
- Operations Teams: Validate inventory records before critical reporting periods.
Implementing these quality checks helps organizations trust their data and make informed decisions. This proactive approach to data quality saves time and increases confidence in analysis results. A systematic approach like this builds confidence and ensures you are working with reliable information. At SumproductAddict, we empower data professionals to enhance their skills. Check out this helpful resource on mastering Excel fundamentals.
Combining Datasets: Merges and Joins That Actually Work

This section of our Excel Power Query tutorial explores one of its most powerful features: combining data. Power Query offers two main methods: appending and merging.
Appending stacks tables vertically, effectively adding rows. Merging, conversely, joins tables horizontally based on common columns, linking related data. Understanding this difference is crucial for effective data analysis.
Appending: Stacking Data Vertically
Appending is perfect when you have multiple tables with identical structures that you want to consolidate. Imagine stacking blocks to build a tower. For instance, if your sales data from different regions lives in separate tables with the same columns, appending combines them into a single, comprehensive view. This simplifies analysis across all regions.
Merging: Joining Data Horizontally
Merging connects tables based on a shared column, producing a new table with the combined information. Think of fitting puzzle pieces together. This is invaluable for linking related data from different sources. For example, merge a customer information table (names, IDs) with a transaction table (dates, amounts, customer IDs) using the "customer ID" column. This creates a unified view of each customer and their purchase history, allowing for in-depth analysis.
Understanding Merge Types: Inner, Outer, Left, Right, and Anti
Power Query offers a variety of merge types to handle diverse table relationships:
-
Inner Join: Returns only the rows that match in both tables.
-
Outer Join: Includes all rows from both tables, using null values for non-matching entries.
-
Left Join: Includes all rows from the left table and matching rows from the right table.
-
Right Join: Includes all rows from the right table and matching rows from the left table.
-
Anti Join: Returns rows from the first table that don't match any in the second.
The right merge type depends on your analysis needs. An inner join suits scenarios where you only need data present in both tables. An outer join, however, is useful for identifying records exclusive to one table. Check out our guide on How to master... for more details.
Handling Real-World Challenges
Merging real-world data often presents challenges like inconsistent formatting in shared columns. Power Query provides tools to clean and transform your data beforehand, addressing issues like text case variations or different date formats. Knowing how to handle unmatched rows gracefully, perhaps by filling nulls or filtering, is also key for reliable analysis. Finally, optimizing performance when working with large datasets keeps your queries efficient.
Practical Applications of Merges and Joins
Merging and joining are essential for many business scenarios. Sales teams merge customer and transaction data for targeted marketing. Marketing analysts combine metrics from various platforms to evaluate campaign performance. Financial professionals consolidate reports from different departments for a holistic financial view. These examples demonstrate how data merging supports informed decisions across diverse business functions.
Building Reusable Solutions: From Novice to Power User
This section of our Excel Power Query tutorial will take your skills to the next level. We'll explore how leading organizations build scalable and maintainable solutions, dramatically reducing repetitive tasks. This involves mastering techniques like custom functions, parameterized queries, and modular query structures. These are the skills that separate casual users from true Power Query experts.
Creating Custom Functions for Complex Transformations
Imagine repeatedly performing a complicated data cleaning process across multiple projects. Instead of manually repeating these steps, you can create a custom function in Power Query. This function encapsulates the transformation steps, allowing you to apply them to any dataset with a single click.
For example, a custom function could standardize inconsistent date formats or extract key details from complex text strings. This reusability not only saves valuable time but also ensures consistency across all your projects.
Parameterizing Queries for Adaptability
Data sources are constantly changing. Parameterizing your queries allows you to prepare for these changes. Instead of hardcoding file paths or server names, use parameters.
This allows you to easily update the data source without having to modify the underlying query logic. It's like swapping ingredients in a recipe – the process remains the same, but the inputs change.
Building Modular Query Structures
Break down complex transformations into smaller, manageable modules. This simplifies debugging and makes your queries much easier to understand and modify. Each module performs a specific task.
These modules can then be combined into a final query. This modular approach is similar to building with LEGO bricks—individual pieces come together to create a larger, more complex structure.
Real-World Examples of Reusable Solutions
These techniques have practical applications in various business settings:
- Financial Teams: Build reusable month-end closing processes, automating data aggregation and report generation.
- Marketing Analysts: Create adaptable campaign report templates for different campaigns and data sources.
- Operations Teams: Develop automated data quality checks, ensuring consistent data integrity across systems.
Best Practices for Reusable Power Query Solutions
Here are a few best practices that will enhance the long-term value of your Power Query solutions:
- Documentation: Clearly document the purpose and logic behind your custom functions and queries. This helps others (and your future self) understand and maintain your work.
- Dependency Management: Track dependencies between queries to avoid unexpected errors when making changes.
- Error Handling: Implement robust error handling to ensure your solutions continue to work even if the underlying data changes.
Becoming the Go-To Power Query Expert
By mastering these advanced techniques, you'll significantly increase your productivity and become a valuable resource within your organization. You'll be the go-to expert for Power Query solutions, driving efficiency and data-driven decision-making. This expertise positions you as a leader in effectively leveraging data. It also allows you to create adaptable solutions that meet evolving data needs, ensuring long-term value.
Ready to take your Excel skills to the next level? SumproductAddict offers a range of Excel-themed apparel and accessories for the data enthusiast. From witty t-shirts and hoodies to practical desk mats and mugs, celebrate your passion for spreadsheets in style. Visit SumproductAddict today and discover the perfect gear to express your data-driven personality. Use code FIRST10 at checkout for an exclusive discount!
Article created using Outrank