
How to Build Financial Models in Excel: A Step-by-Step Guide
The Mindset Behind Powerful Financial Models

Building robust financial models in Excel requires more than just knowing formulas and functions. It requires a strategic mindset, transforming spreadsheets from static data into dynamic decision-making tools. This perspective shift separates truly exceptional financial models from the rest. It's about understanding how successful modelers balance analytical rigor with practical business sense.
Thinking Beyond the Numbers
Effective financial models don't just crunch numbers; they tell a story. They illustrate potential futures based on a clear understanding of the present. For example, projecting an e-commerce business's future revenue requires more than extrapolating past growth.
You need to consider market trends, competitive pressures, and planned marketing campaigns. This creates a model that projects revenue and explains the reasoning behind those projections.
Building financial models in Excel is a crucial skill for financial analysts and professionals. As of 2025, Excel remains the primary tool for financial modeling because of its flexibility and robust features, such as creating complex financial statements and conducting scenario analyses. Learn more about financial modeling here: Wall Street Prep Financial Modeling
Choosing the Right Model for the Job
Different business challenges require different modeling approaches. A three-statement model, linking the income statement, balance sheet, and cash flow statement, provides a comprehensive view of a company's financial health. However, a discounted cash flow (DCF) analysis is better suited for valuing a business or investment opportunity.
An M&A model helps analyze the potential financial impact of a merger or acquisition. Understanding each approach's strengths and limitations is crucial for choosing the correct tool for the job.
Balancing Complexity and Usability
Sophisticated formulas and intricate calculations can be impressive, but they can also obscure a model's core message. A model that’s too complex can become difficult to understand, update, and audit, making it less likely to be used and trusted by decision-makers.
The best models strike a balance between detail and usability. They incorporate enough detail for accuracy and insight while remaining user-friendly and transparent. This involves using clear labels, consistent formatting, and thorough documentation to ensure everyone understands the model's logic. The ultimate goal is to create a tool that empowers stakeholders to make informed decisions.
Crafting Your Excel Foundation for Modeling Success
The architecture of your Excel workbook is essential for a successful financial model. Just like a skyscraper needs a solid foundation, your model requires a robust structure to handle complexity and ensure accuracy. This involves organizing your data, using clear naming conventions, and strategically applying color-coding. These techniques transform a simple spreadsheet into a powerful, user-friendly tool.
Structuring Your Workbook For Clarity
A well-structured workbook separates inputs, calculations, and outputs, making it easier to understand, navigate, and audit. Think of it like a well-organized kitchen: ingredients (inputs) are separate from the cooking process (calculations), resulting in a delicious meal (outputs). This clear separation minimizes confusion and simplifies troubleshooting.
-
Inputs: Create a dedicated sheet for all your inputs. This includes assumptions about growth rates, costs, and other key variables.
-
Calculations: Perform all calculations on separate sheets. This isolates the model's logic and prevents accidental changes to inputs.
-
Outputs: Present your results on designated output sheets. This allows users to quickly access key findings without sifting through complex formulas.
The Power of Visual Cues: Color-Coding
Color-coding isn't just about aesthetics; it's a powerful tool for reducing errors and improving comprehension. A consistent color-coding system can significantly reduce the risk of referencing the wrong cells.
For example, using blue for inputs, black for formulas, and green for outputs creates a visual hierarchy. This visual guide reduces cognitive load and improves efficiency and accuracy.
Naming Conventions: Making Formulas Self-Explanatory
Confusing cell references can make a model difficult to maintain. Imagine trying to decipher a recipe with ingredients labeled "A," "B," and "C." Instead, use descriptive names for your cells and ranges.
This transforms cryptic formulas into self-documenting calculations. For example, Revenue_2024 is far clearer than C45. This practice makes future updates and audits much easier.
Building Flexible and Scalable Templates
Creating flexible templates lets you adapt your models to different scenarios without rebuilding them from scratch. This scalability is crucial for efficient financial modeling. Start with a basic template that includes core components of your model, like the three financial statements.
You can then customize it for specific analyses, from quick valuations to complex forecasts, without starting over each time. This modular approach saves time and effort while maintaining consistency.
Mastering Excel Efficiency Techniques
Keyboard shortcuts and other Excel efficiency techniques can drastically reduce modeling time. While a novice modeler might spend days building a complex model, a seasoned professional can often accomplish the same in hours.
This proficiency comes from mastering Excel's built-in features, like data tables and array formulas. These tools automate repetitive tasks and streamline calculations, significantly boosting productivity. Learning these techniques isn't just about speed; it's about freeing up your time to focus on the strategic aspects of modeling, such as interpreting results and making informed decisions.
Developing Projections That Actually Reflect Reality
Building a financial model in Excel involves more than simply entering numbers. It requires crafting projections that truly reflect the complexities of your business and the realities of the market. This is where skillful financial modeling transforms historical data into forward-looking insights that can drive important business decisions.
Selecting the Right Drivers
Expert financial modelers understand that drivers are crucial for creating realistic projections. These are the operational metrics that directly influence financial outcomes.
For a SaaS business, key drivers might include customer churn rate, customer acquisition cost, and average revenue per user (ARPU). Choosing the right drivers connects operational performance to financial results, moving beyond simple growth assumptions.
Incorporating Real-World Factors
Projections should incorporate market dynamics, competitive pressures, and operational constraints. However, this must be done without creating an unwieldy, overly complex model.
For example, a retail business might factor in seasonality trends, competitor promotions, and supply chain disruptions when projecting sales. This adds nuance to the projections, creating a more realistic and robust financial narrative. Financial models often involve forecasting revenue and expenses using Excel's forecasting tools. A company might forecast its revenue to grow by 10% annually for the next five years, easily modeled using formulas. For more detailed information on financial modeling, visit Wall Street Prep Financial Modeling.
Balancing Granularity and Usability
The infographic below visualizes the ideal balance between different sections of your workbook (inputs, calculations, and outputs). It also compares the time spent on data entry with manual versus structured approaches and shows how error rates typically decline as models are refined.
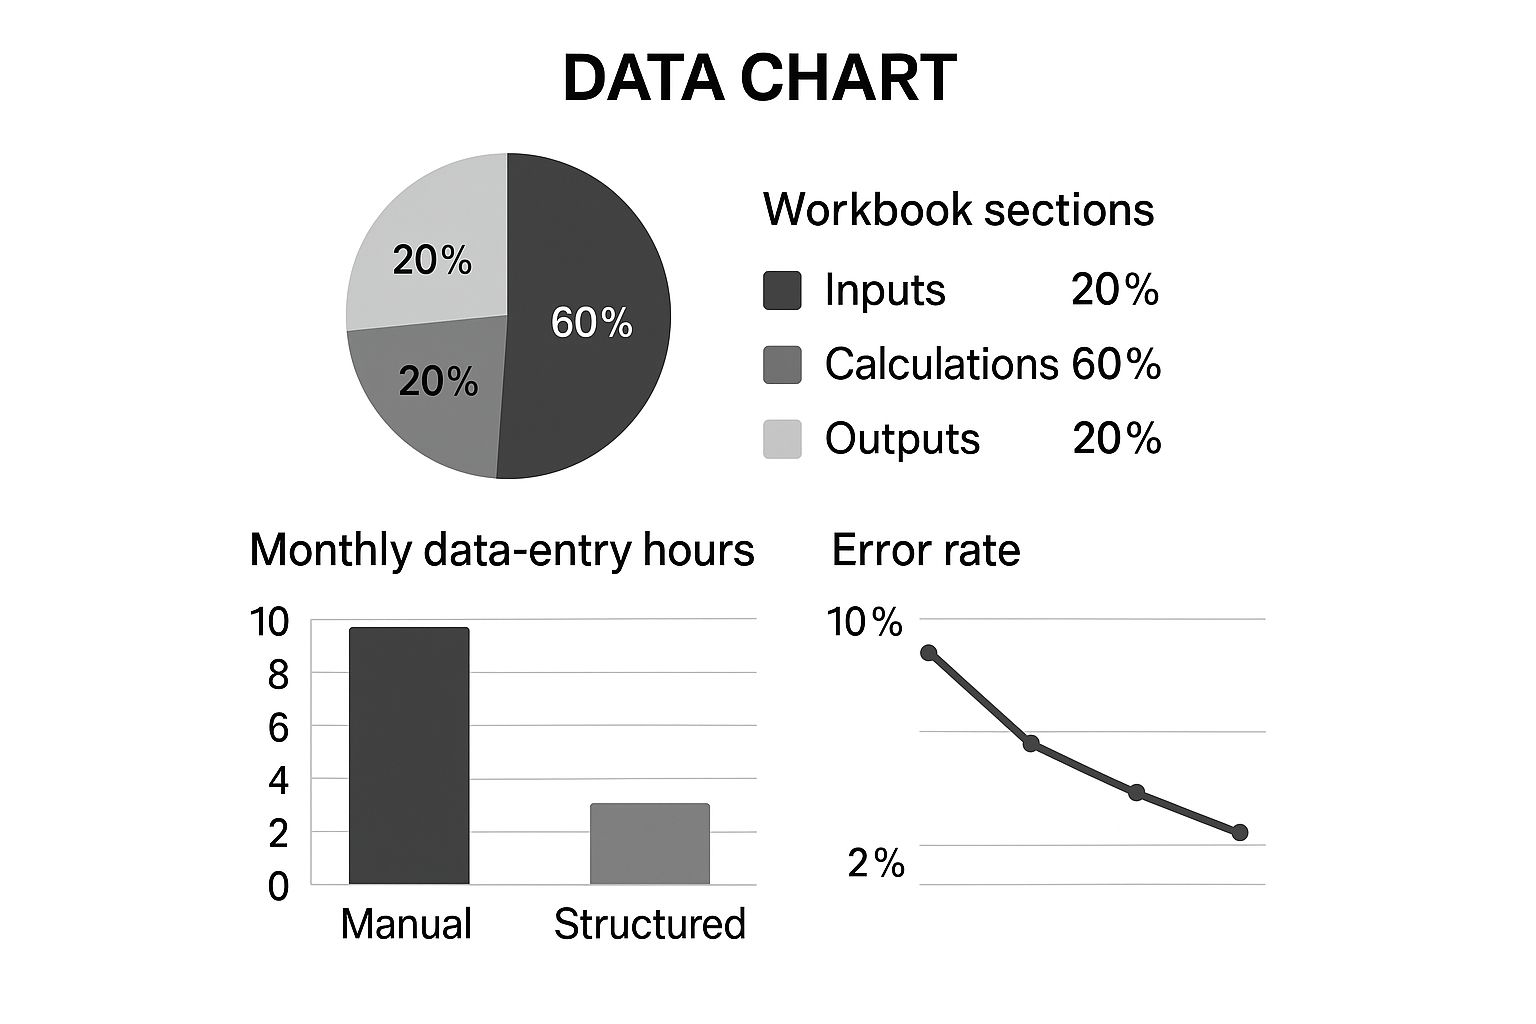
As the infographic illustrates, a structured approach to financial modeling can significantly reduce data entry time and improve accuracy. The recommended 60/20/20 split for calculations, inputs, and outputs keeps the model organized and efficient. Understanding data analysis principles is critical once your foundations are in place. Learn more in this article about Data Analysis and Business Intelligence.
Stress-Testing Your Assumptions
A robust financial model isn't just about creating projections; it's about testing them against various scenarios. Stress-testing involves evaluating how your model performs under different market conditions, competitive pressures, and internal operational changes.
This might involve simulating a recession, a sudden increase in competition, or a supply chain disruption. By rigorously testing your assumptions, you can identify potential weaknesses and build greater confidence in your projections, ensuring your financial models in Excel are as accurate as possible. This process transforms your model into a strategic decision-making engine, capable of guiding strategic planning and resource allocation.
To further enhance your financial modeling skills, consider the following common projection methods available in Excel:
To help illustrate different forecasting approaches, let's explore a few common methods used within Excel:
Common Financial Projection Methods in Excel This table compares different forecasting methods available in Excel, highlighting their strengths, weaknesses, and ideal use cases.
| Projection Method | Best For | Key Excel Functions | Limitations |
|---|---|---|---|
| Straight-Line | Simple, consistent growth |
=A1 + (B1*C1) (where A1 is the starting value, B1 is the growth rate, and C1 is the period) |
Doesn't account for fluctuations or seasonality |
| Moving Average | Smoothing out short-term fluctuations |
=AVERAGE(A1:A10) (for a 10-period moving average) |
Lagging indicator, doesn't predict future trends well |
| Exponential Smoothing | Forecasting with recent data weighted more heavily | =FORECAST.ETS |
Assumes a consistent trend, may not capture turning points effectively |
This table summarizes a few common forecasting methods, demonstrating how Excel provides a variety of tools to cater to different forecasting needs. Choosing the appropriate method depends on the specific characteristics of your data and the desired level of complexity.
Creating Interconnected Financial Statements That Flow

The true power of a financial model in Excel lies in how its financial statements connect and interact. Expert financial modelers know how to create a smooth flow between the income statement, balance sheet, and cash flow statement. This interconnectedness ensures the model remains accurate and reliable, even when exploring different scenarios. Let's delve into the practical methods for building these critical connections.
Mastering Circular References
A common challenge in financial modeling is managing circular references. These occur when a formula refers back to its own cell, directly or indirectly. While sometimes unavoidable, they can cause errors and instability within the model.
A typical example is calculating interest expense. This depends on the debt balance, which, in turn, is affected by the interest expense itself. One solution is using Excel's iterative calculation feature. This lets Excel recalculate formulas repeatedly until a stable result is achieved. However, use this cautiously, as unexpected results can occur. Another approach is using a "plug" figure – a manually adjusted value – to break the circularity, offering more control.
The Importance of Balance Sheet Balancing
A balanced balance sheet is essential, not just for mathematical correctness, but also as a crucial check on the model's accuracy. The fundamental accounting equation (Assets = Liabilities + Equity) must always be true.
An unbalanced balance sheet points to an error within the model. A good practice is to include a "check" cell that calculates the difference between assets and the sum of liabilities and equity. This provides a clear visual indicator if the model needs correcting, preventing errors from spreading through the interconnected statements.
Modeling Complex Financial Mechanisms
Real-world financial activities require more sophisticated approaches than simple formulas. For instance, modeling working capital dynamics involves understanding how changes in accounts receivable, inventory, and accounts payable impact cash flow.
Likewise, a depreciation waterfall calculates depreciation expense over time based on different asset classes and depreciation methods. Debt servicing schedules track principal and interest payments on loans, reflecting real-world loan structures.
Handling Different Time Periods
A truly useful financial model adapts to different time periods, from monthly to annually, without issues. This flexibility allows you to analyze both short-term and long-term trends.
One effective method is to use a time period selector that dynamically adjusts the formulas and data displayed based on the chosen timeframe. This lets users easily switch between monthly, quarterly, and annual views without changing the underlying calculations. By mastering these interconnectedness strategies, you can transform individual spreadsheets into dynamic financial ecosystems, offering comprehensive insights into business performance and enabling more informed, data-driven decisions.
Transforming Models into Strategic Decision Engines
Financial models built in Excel are more than just spreadsheets; they're powerful tools for strategic decision-making. Experienced financial modelers know how to transform static projections into dynamic planning tools that inform critical business decisions. This involves techniques like sensitivity analysis, scenario planning, and data visualization to enhance the model's usability and strategic value.
Implementing Sensitivity Analysis
Sensitivity analysis is a key feature of Excel financial models. It reveals which variables truly drive outcomes and which are less impactful. One of the biggest advantages of using Excel for financial modeling is the ability to conduct sensitivity analysis and scenario planning. This allows businesses to test how different variables, such as market condition changes or fluctuating commodity prices, affect their financial performance. For example, a business might use sensitivity analysis to assess the impact of a 5% increase in raw material costs on its profitability. Discover more insights about financial modeling in Excel: Macabacus Blog on Financial Modeling
By systematically varying key inputs, like sales growth or cost of goods sold, you can observe the corresponding changes in key outputs like net income or return on investment. This reveals the model’s sensitivities and identifies the most critical assumptions. Excel's Data Tables feature provides a structured way to conduct sensitivity analysis, allowing efficient exploration of various scenarios.
Building Scenario Planning Tools
Beyond sensitivity analysis, scenario planning allows exploration of different potential futures. By creating scenario toggles in your model, non-technical stakeholders can easily switch between pre-defined scenarios like best-case, base-case, and worst-case.
These toggles can be implemented using Excel functions like CHOOSE or INDEX/MATCH. This allows users to select a scenario and see the resulting impact on the model’s projections without changing the underlying formulas. This empowers decision-makers to understand the potential range of outcomes and make informed choices based on different assumptions.
Creating Visual Dashboards
Dense numerical data can be overwhelming. Transforming this data into visually compelling dashboards makes insights readily apparent.
- Charts and Graphs: Visualize key trends and relationships. Line charts can show revenue growth over time, and bar charts can compare performance across different product lines.
- Key Performance Indicators (KPIs): Display essential metrics like profitability, revenue growth, and market share in a clear format.
- Conditional Formatting: Use color scales or icon sets to highlight important data points or variances from targets, drawing attention to critical areas.
These visual aids transform complex analyses into actionable intelligence, enabling decision-makers to grasp key insights and make informed decisions based on easy-to-understand information.
Utilizing Monte Carlo Simulations
While traditional financial models often rely on single-point estimates, Monte Carlo simulations embrace uncertainty. By running thousands of iterations with randomly varying inputs based on probability distributions, you can generate a range of possible outcomes and assess the likelihood of hitting specific targets.
Although more complex, Monte Carlo simulations can be implemented in Excel using add-ins or custom VBA code. They provide a more realistic view of potential futures by accounting for the inherent uncertainty in financial projections, shifting from false precision to probability-based outcomes. This enhances decision-making by providing a deeper understanding of risks and opportunities.
Excel Techniques That Separate Amateurs From Experts

Building robust financial models in Excel requires more than just basic spreadsheet knowledge. It involves mastering advanced techniques that transform simple spreadsheets into dynamic, powerful tools. These techniques not only boost efficiency and accuracy but also elevate your skills, distinguishing you as a true Excel expert. Let's explore some of these key Excel techniques.
Beyond VLOOKUP: The Power of INDEX-MATCH
While VLOOKUP is a commonly used function for looking up values, it has limitations, especially with larger datasets or when the lookup column isn't the first one in the table. VLOOKUP can be cumbersome in these scenarios. The INDEX-MATCH combination offers a more adaptable and efficient alternative. INDEX retrieves a value from a specified range, and MATCH pinpoints a value's position within a range. Combined, they handle lookups in any direction and manage complex scenarios effectively.
Dynamic Ranges with OFFSET and INDIRECT
Static ranges can be problematic when your data changes. The OFFSET and INDIRECT functions help by creating dynamic ranges that automatically adjust to these changes. OFFSET defines a range by a starting cell and offsets, while INDIRECT builds cell references from text strings. These dynamic ranges ensure your formulas stay accurate as your data grows or shrinks.
Streamlining Calculations with Array Formulas
Array formulas perform complex calculations across multiple cells simultaneously, eliminating intermediate steps. This simplifies your models and reduces the risk of errors. For example, an array formula can sum all rows at once instead of calculating each row's sum individually. This not only saves time but also makes your model cleaner and easier to understand.
Excel's data tables feature lets you easily vary input assumptions and see the impact on financial outcomes. Financial models can also evaluate mergers and acquisitions by modeling the combined financial statements of the companies involved, helping to identify potential synergies and estimate the deal's financial benefits. Explore further with this Macabacus Blog on Financial Modeling.
Visual Insights with Conditional Formatting
Raw data can be hard to interpret quickly. Conditional formatting adds visual clarity by applying formatting based on specific conditions. You can highlight cells above a certain value, use color scales to represent values, or display icons to indicate performance against targets. These visual cues make trends and outliers immediately clear, significantly enhancing your model's communicative power. While transforming your models, consider the importance of strategic planning within your organization.
Ensuring Data Integrity with Data Validation
Input errors can compromise any financial model's accuracy. Data validation prevents these errors by controlling the data entered into specific cells. You can restrict entries to numbers within a range, dates, or predefined lists. This enhances data integrity and makes your models user-friendly, especially for those with different levels of Excel experience. This ensures your models are robust, accurate, and accessible to all stakeholders. Mastering these advanced Excel techniques is essential for building effective and accurate financial models, helping you become a true Excel expert.
Building Models That Stand Up to Professional Scrutiny
A well-designed financial model in Excel can be rendered useless if it lacks credibility. Transparency and maintainability are also essential. These qualities distinguish a professional model from a basic spreadsheet. This section explores the documentation, auditing practices, and stress-testing techniques that ensure your models are robust, reliable, and ready for review.
Documentation: Making Your Assumptions Transparent
Experienced financial modelers know that documentation is key. It's an integral part of the model-building process, not an afterthought. Building documentation directly within the Excel workbook improves transparency and accessibility.
This involves clear labels, comments, and dedicated documentation sheets. These should explain the model's logic, data sources, and key assumptions. This transparency builds trust with stakeholders. It also ensures everyone understands the model's workings. For example, documenting growth rate assumptions for revenue projections helps others understand the basis of your forecasts.
Version Control: Tracking Evolutionary Changes
Financial models rarely stay the same. They evolve as new data becomes available or business strategies shift. Version control prevents accidental overwrites and lets you track the model's changes.
One method is saving different model versions with clear names. Examples include "Model_v1," "Model_v2," etc. More advanced approaches use Excel's Track Changes feature or external version control systems. This lets you compare versions, identify changes, and revert to earlier versions if necessary.
Financial models can also evaluate different scenarios. Think changes in market share or interest rates. Excel's scenario manager helps model these impacts. It allows users to create scenarios and compare outcomes. Learn more about financial modeling at Wall Street Prep Financial Modeling.
Stress-Testing: Identifying and Addressing Weaknesses
A robust financial model can handle rigorous testing. Stress-testing involves pushing your model to extremes. This helps identify potential errors, circular references, and unrealistic assumptions.
For example, simulate a large drop in sales. You could also test a dramatic cost increase or a major market shift. This rigorous process ensures your model is robust and can handle a range of outcomes.
User Guides and Walkthroughs: Enhancing Accessibility
Even the best financial model is useless if nobody understands it. User guides and walkthrough sheets make complex models more accessible.
A user guide can provide step-by-step instructions. It can also explain key inputs and outputs and offer troubleshooting tips. A walkthrough sheet within the workbook can explain the model's logic and functions. These resources empower colleagues and clients to use the model effectively, maximizing its impact.
The following checklist provides a comprehensive review before finalizing your financial model:
Financial Model Quality Checklist
This table provides a comprehensive checklist of items to verify before finalizing a financial model, ensuring accuracy and usability.
| Check Category | Verification Item | Priority Level | Common Issues |
|---|---|---|---|
| Inputs | All inputs accurately sourced and documented | High | Incorrect or outdated data, undocumented assumptions |
| Formulas | All formulas correct and error-free | High | Circular references, incorrect calculations |
| Logic | Model logic flows correctly and reflects business realities | High | Inconsistent assumptions, unrealistic projections |
| Outputs | Outputs are clear, concise, and easily understood | High | Confusing or misleading presentation of results |
| Documentation | Comprehensive documentation explaining assumptions and methodology | High | Lack of clarity, difficulty understanding model logic |
| Sensitivity Analysis | Key drivers identified and tested | High | Overlooking critical variables, unrealistic scenarios |
| Error Checks | Model includes error checks and safeguards | High | Unbalanced balance sheet, cash flow discrepancies |
| Usability | Model is user-friendly and easy to navigate | Medium | Complex structure, difficult to update or modify |
| Version Control | Model versions tracked and managed | Medium | Risk of overwriting previous versions, difficulty tracking changes |
This checklist helps ensure your model is accurate, reliable, and easy to use. Regularly reviewing these items improves the overall quality and effectiveness of your financial models.
Ready for some Excel gear? Visit SumproductAddict for apparel and accessories designed for data enthusiasts. Use code FIRST10 for 10% off your first order.