Mastering Data Modeling Techniques
Think of data modeling techniques as the different ways we draw a map for our data. They're the methods we use to sketch out how information is organized and connected, both to other pieces of data and to real-world business concepts. Ultimately, these techniques give us a blueprint for building databases that are logical, efficient, and ready to grow with our needs.
Why Data Modeling Is Your Architectural Blueprint
You wouldn’t build a skyscraper without a detailed architectural plan, right? Doing so would be asking for a structural disaster. Data modeling plays that exact same role for your information systems. It’s the essential blueprint that dictates how your data is constructed, stored, and accessed.
Without a solid model, you’re basically winging it. You end up with a chaotic "data swamp" where information is a mess—it's inconsistent, duplicated everywhere, and a nightmare to use. This mess inevitably leads to unreliable reports, broken apps, and bad business decisions. Effective data modeling is the discipline that brings order to that chaos.
From Ideas to Implementation
Let's imagine we're designing a new library. The first conversation is always high-level. Stakeholders would say things like, "We need a fiction section, a non-fiction area, and a children's corner." This is the first step of modeling—it’s all about agreeing on the big picture and getting everyone on the same page.
From there, the plan gets more specific. You'd start mapping out which genres go in the fiction section and what subjects belong in non-fiction. Then, you'd figure out the physical layout: the exact aisle numbers, shelf heights, and the cataloging system the database will use. Each step adds another layer of detail, moving from a fuzzy idea to a concrete plan. This structured process helps you catch fundamental design flaws that would be incredibly expensive and time-consuming to fix down the road.
Data modeling is less about memorizing technical rules and more about creating a shared understanding. It’s the bridge that translates business needs into a technical specification that both executives and developers can agree on.
This process ensures the final structure is not just sturdy but actually useful. Just like a well-designed library makes finding a book feel intuitive, a well-modeled database makes retrieving information fast and reliable. The end goal is always to create a data structure that supports what the business wants to achieve, whether that's running an e-commerce site or powering a sophisticated analytics platform.
And of course, well-structured data is the foundation for creating clear, insightful reports. If you're curious about turning that data into compelling visuals, you should explore some data visualization best practices for impactful insights that bring it all to life.
To help you keep track, here’s a quick overview of the main techniques we'll be discussing. Think of it as a cheat sheet for understanding what each model is designed to do.
Core Data Modeling Techniques at a Glance
| Technique | Primary Focus | Key Outcome |
|---|---|---|
| Conceptual | High-level business concepts and rules. | A shared understanding of what the system will contain. |
| Logical | The structure of the data and its relationships. | A detailed map of data entities, attributes, and rules. |
| Physical | How the data will be stored in a specific database. | A ready-to-implement database schema. |
| Dimensional | Optimizing data for fast analysis and reporting. | A denormalized structure with facts and dimensions (Star Schema). |
| Relational (ERD) | Defining relationships between data entities. | A normalized structure that minimizes data redundancy. |
Each of these techniques serves a different purpose, moving from a broad business vision to a specific, technical implementation. Now, let’s dig into each one.
The Three Levels of Data Modeling: From Sketch to Reality
Every solid data structure is built in layers. You don't just jump straight into code. Instead, you move from a high-level vision to a detailed, technical implementation, ensuring what gets built actually solves the right business problem.
This journey happens across three levels: the conceptual, logical, and physical data models. Think of it like building a house. You start with a simple sketch of the rooms (conceptual), then create a detailed architectural blueprint (logical), and finally, draw up the specific construction plans for the plumbers and electricians (physical). This layered approach is a cornerstone of good data design, preventing misunderstandings and expensive rework down the line.
Let's walk through each stage using a familiar example: an e-commerce platform processing a customer order.
Conceptual Model: The Whiteboard Sketch
The conceptual data model is the 30,000-foot view. It’s all about the business, completely non-technical, and simple enough to draw on a whiteboard. Its only job is to identify the most important business entities and the relationships between them. No data types, no primary keys, just the core concepts.
For our e-commerce store, the conceptual model would show:
-
Entities: The key "things" we care about, like
Customer,Product, andOrder. -
Relationships: How these things connect. For instance, a
Customerplaces anOrder, and anOrdercontains aProduct.
This model is a communication tool. It’s what you use to get everyone—from stakeholders to project managers—to nod in agreement on the scope. Getting this high-level view right first is absolutely critical before any deeper work begins.
The infographic below shows what this initial "whiteboard sketch" phase looks like in action.
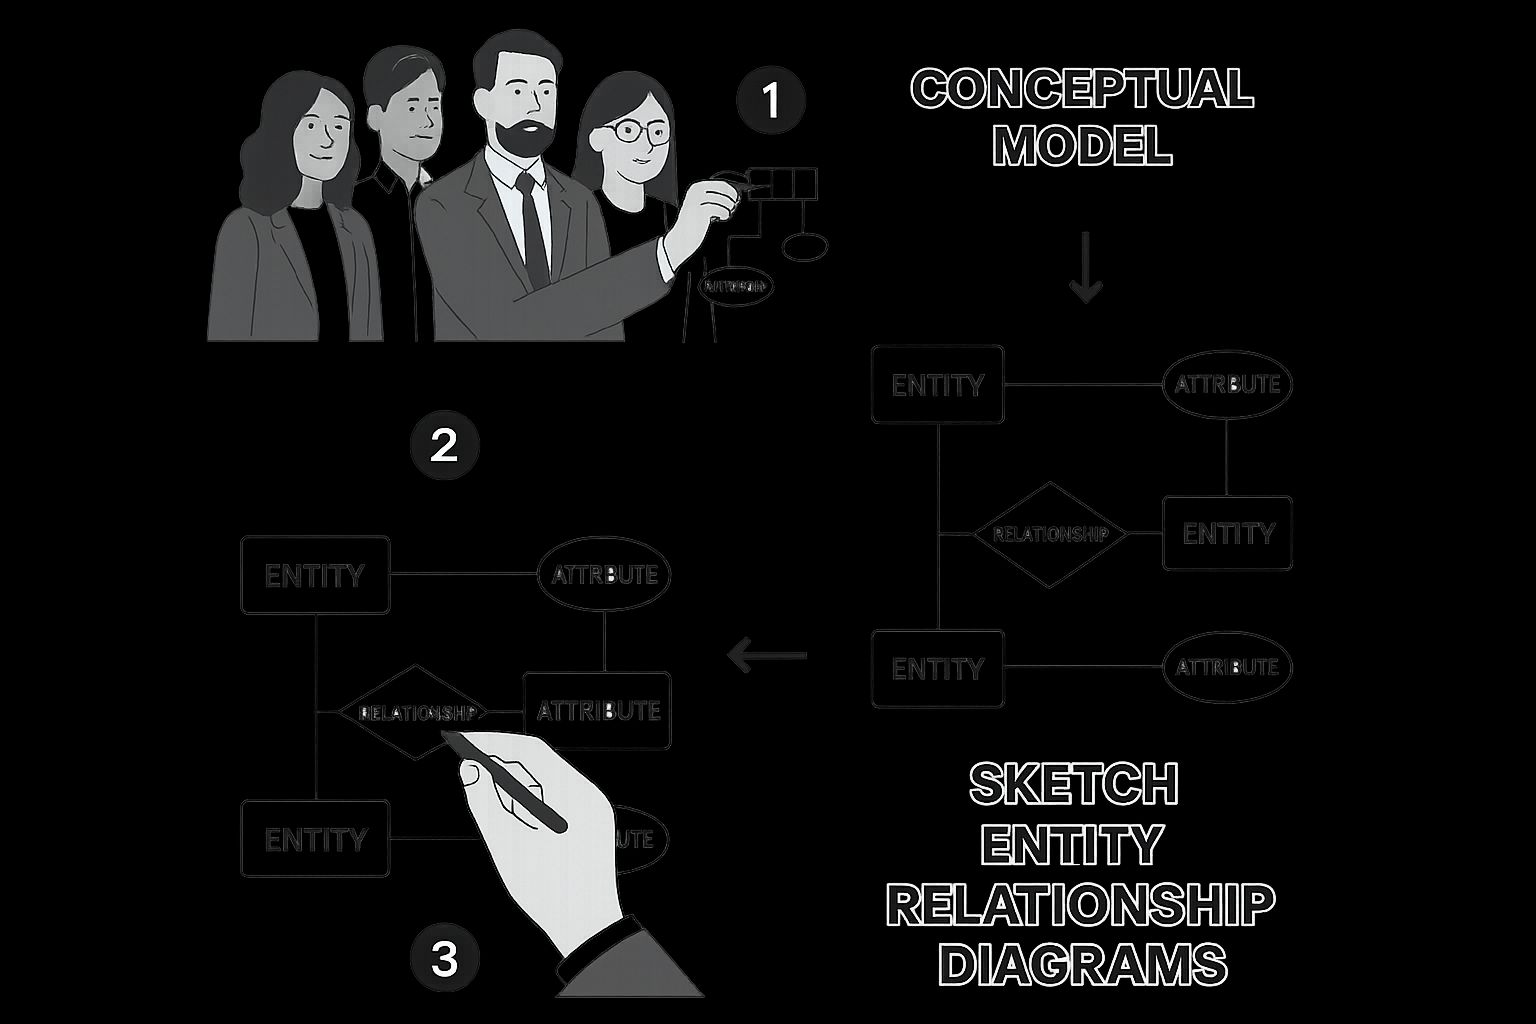
It perfectly captures the collaborative, big-picture nature of conceptual modeling, where the entire focus is on business ideas, not database specifics.
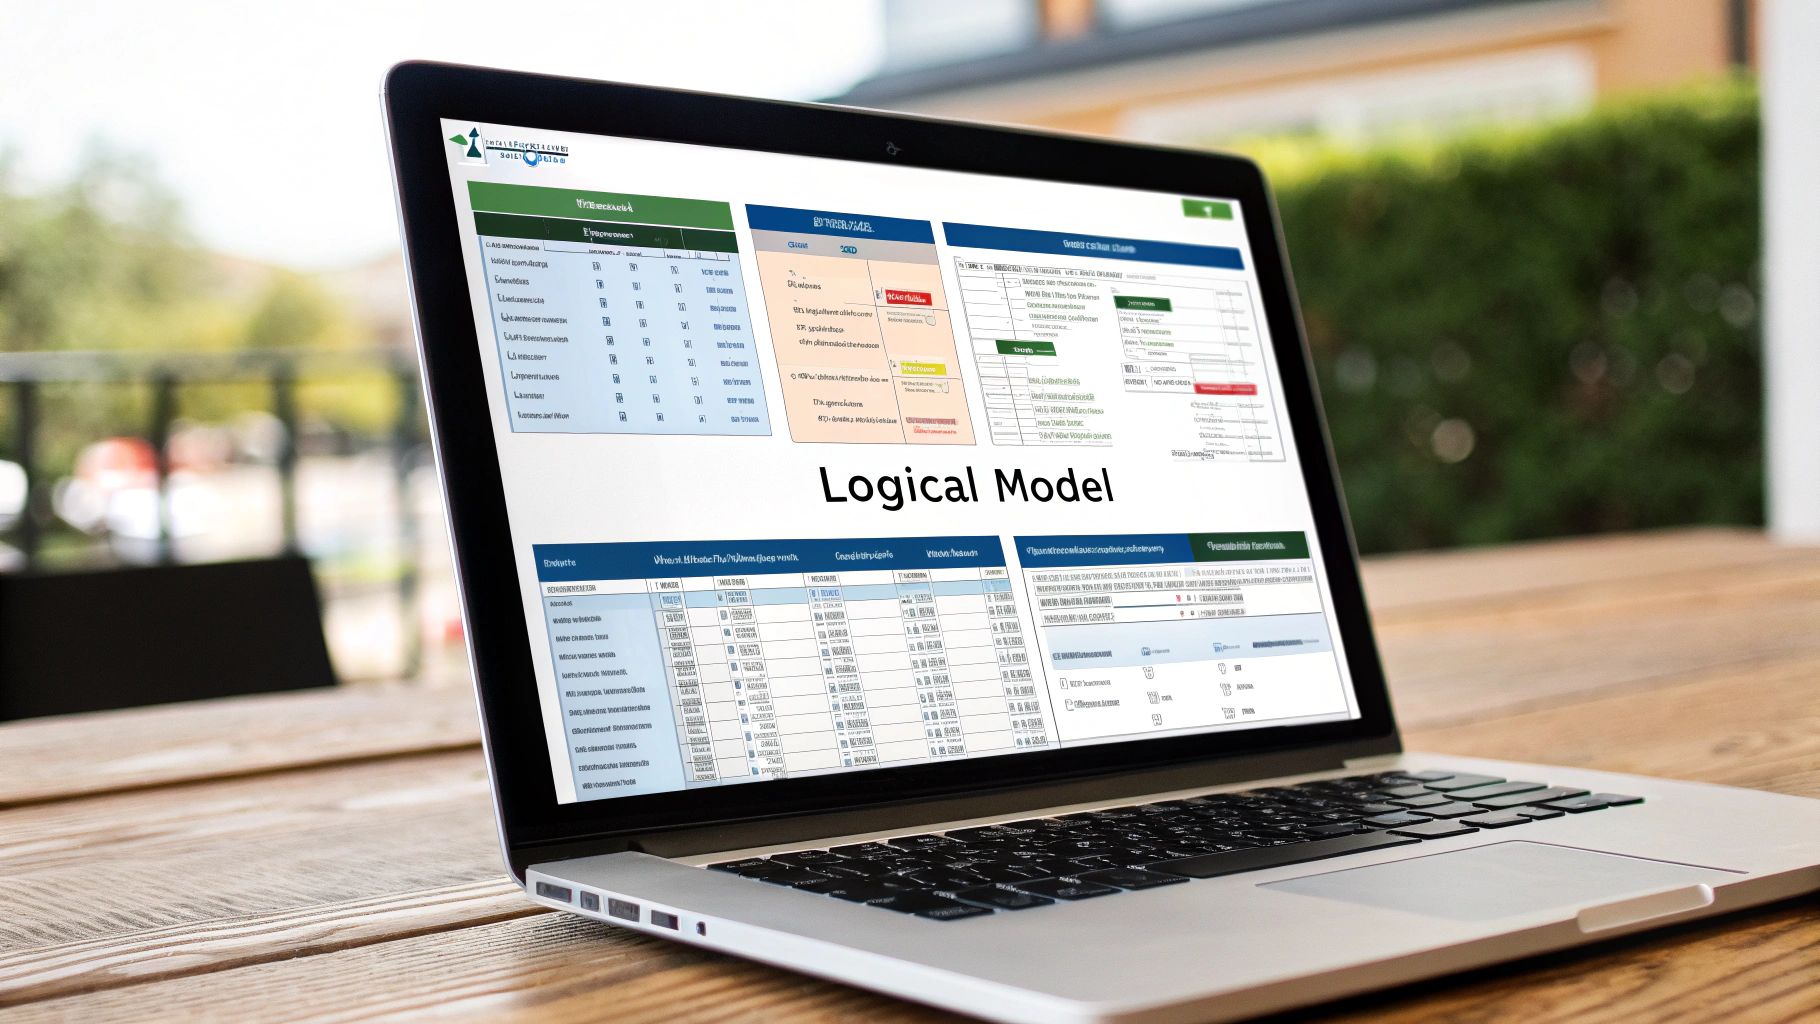
Logical Model: The Architect's Schematic
Once the sketch is approved, it’s time to add some real detail. The logical data model is the architect’s schematic. It builds on the conceptual model by defining the attributes (the properties or characteristics) of each entity and clarifying the relationships more formally.
But here's the key part: the logical model remains technology-agnostic. It doesn't care if you're using PostgreSQL, Oracle, or something else entirely. It describes what data you need, not how it will be physically stored.
A logical model is the definitive plan for your data structure. It's a structured, detailed blueprint of all data requirements, free from the constraints or features of any specific database technology.
Let's go back to our e-commerce example. The logical model would add more substance:
- The
Customerentity now has attributes likeCustomerID,FirstName,LastName, andEmail. - The
Productentity gets fleshed out withProductID,ProductName,Price, andDescription. - The
Orderentity would includeOrderID,OrderDate, andCustomerID(as a foreign key to link back to the customer).
This model is the primary reference for data architects, business analysts, and developers. It’s the blueprint they use to really understand the data's structure and rules before writing a single line of code. If you want to see how this kind of structured data comes to life in a more hands-on way, our guide to Excel data analysis is a great next step.
Physical Model: The Construction-Ready Blueprint
Finally, we get to the physical data model. This is the nuts-and-bolts, construction-ready blueprint. It translates the logical model into a concrete, implementable schema for a specific database system. All the technical details required to actually build the database live here.
This is where your technology choices really matter. The physical model includes:
- Table and Column Names: The exact names as they will appear in the database.
-
Data Types: Specifying
VARCHAR(100)for a name,INTfor an ID, orTIMESTAMPfor a date. - Primary and Foreign Keys: Defining the exact keys needed to enforce relationships.
- Indexes and Constraints: Adding optimizations for performance and rules for data integrity.
For our e-commerce platform, if we decided to use a PostgreSQL database, the physical model would specify that CustomerID is an INTEGER and the primary key for the Customers table. It would also define an index on the OrderDate column to make sure queries run fast. This model is the final step before someone creates the database, and it’s used almost exclusively by DBAs and developers.
How Data Modeling Evolved With Technology
Data modeling techniques didn't just pop into existence. They were forged in the fire of changing business needs and technological breakthroughs. Understanding this evolution is like watching a story unfold, where each new chapter solves a problem the previous one created. It gives you the "why" behind the different methods we use today.
The story really kicks off back in the 1960s. The first management information systems relied on hierarchical and network models. Think of an old-school company org chart—to find an employee, you had to start at the top and follow a single, rigid path down. These models were fast for their time, but incredibly inflexible. Asking a complex question was a serious headache.
The Relational Revolution
The 1990s brought a seismic shift with the rise of the relational model and its now-universal language, Structured Query Language (SQL). This new approach, pioneered by Edgar Codd, was beautifully simple: organize data into tables with rows and columns. The real magic was the ability to join these tables together, which was a massive leap in flexibility from the rigid paths of older systems.
This era gave us a standard way to manage and query data, paving the way for robust transactional systems (OLTP). For the first time, businesses had a reliable way to handle daily operations—sales, inventory, customer records—with rock-solid integrity.
The rise of relational databases wasn't just a technical upgrade; it was a fundamental shift that made data accessible and manageable on a massive scale. It laid the groundwork for decades of data-driven business operations.
The Demand for Analytics and Big Data
As companies started piling up transactional data, a new question popped up: "What can all this data actually tell us about our performance?" This hunger for insight sparked the development of Online Analytical Processing (OLAP) and dimensional modeling techniques in the 1990s. Models like the star schema weren't built for fast transactions; they were designed for lightning-fast analysis.
This whole journey can be viewed in four distinct phases. It started in the 1960s with early database systems, shifted to the relational SQL era around 1990, introduced OLAP for analytics, and finally entered the big data phase when NoSQL appeared in 2008. If you want to dig deeper into this history, sources like Dataversity offer some great perspectives.
The most recent chapter began with the explosion of the internet, social media, and IoT devices. The sheer volume and variety of this "big data" simply swamped traditional relational databases. Out of this challenge, NoSQL (Not Only SQL) databases were born around 2008. These new modeling techniques were built for web-scale flexibility, easily handling messy, unstructured data like documents, graphs, and key-value pairs.
Today, all these models live together in harmony. There's no single "best" technique. Instead, data professionals have a whole toolkit at their disposal. We might pick a relational model for banking transactions, a dimensional model for a sales dashboard, and a NoSQL model for a social media feed.
If you're looking to get your hands dirty with modern data challenges, check out our guide on mastering Power Query in Excel for some practical skills.
Choosing Between Relational and Dimensional Models

Once you’re past the big-picture design work, you’ll find yourself standing at a fork in the road. This is where two workhorses of the data world take center stage: relational modeling and dimensional modeling. They might look similar at a glance since both rely on tables, but they're built for entirely different purposes.
Think of it like choosing a vehicle. A slick sports car is perfect for a fast, smooth highway trip. But if you're exploring rugged, unpaved backroads, you need a powerful off-road truck. Relational models are the sports cars, built for the speed and integrity of daily transactions. Dimensional models are the all-terrain vehicles, designed to dig through vast data landscapes for hidden insights.
Relational Modeling and The Power of Normalization
Relational modeling is the absolute bedrock of most transactional systems. We’re talking about the databases that handle e-commerce checkouts, bank transfers, and your company's CRM platform. These are all Online Transaction Processing (OLTP) systems, and their number one job is to keep data consistent and reliable.
The secret sauce here is normalization. You can think of normalization as a meticulous decluttering process for your data. The entire goal is to stamp out redundancy—storing the same piece of information in multiple places—and prevent weird data anomalies. By doing this, you ensure every piece of data has one single, authoritative home. You get there by breaking down big, unwieldy tables into smaller, more focused ones that are all logically linked.
This process usually follows a set of rules called "normal forms." Let's quickly walk through the first three:
- First Normal Form (1NF): This is the most basic rule. It ensures every cell holds just one value and every record is unique. No more stuffing multiple phone numbers or email addresses into a single cell.
- Second Normal Form (2NF): This builds on 1NF and demands that all the data in a row fully depends on the primary key. It’s all about getting rid of partial dependencies.
- Third Normal Form (3NF): Taking it one step further, 3NF removes what are called transitive dependencies. This just means that a non-key field can't depend on another non-key field.
By sticking to these rules, you end up with a highly normalized database that’s incredibly efficient for writing, updating, and deleting data without accidentally creating a mess.
Dimensional Modeling and The Star Schema
While relational models are all about operational precision, dimensional models are built for pure analytical speed. They're the engine humming behind most data warehouses and business intelligence tools—systems we call Online Analytical Processing (OLAP). Their job isn't to process thousands of tiny transactions a minute, but to answer big, complex business questions—fast.
The most common approach here is the star schema, and it gets its name because the diagram literally looks like a star.
A star schema organizes data with a central Fact table surrounded by several Dimension tables. The Fact table holds the numbers (the "facts" or measurements), while the Dimension tables provide all the descriptive context—the who, what, where, when, and why.
Picture a sales report. The Fact table would contain the core metrics like SalesAmount, QuantitySold, and DiscountApplied. The surrounding Dimension tables would give that data meaning:
- A
Customerdimension tells you who made the purchase. - A
Productdimension explains what was sold. - A
Datedimension shows when the sale happened. - A
Storedimension tells you where it took place.
This structure is intentionally denormalized. To make queries run faster and simpler, information is often repeated. For example, a product’s brand name might appear in thousands of rows when you pull the data. This allows analysts to slice and dice information by mixing and matching dimensions without performing a bunch of complicated joins—a process that becomes even more powerful with tools like those we cover in our guide to unlocking data insights with Excel Pivot Table examples.
The Role of Statistics in Model Design
It's fascinating how much these modern data modeling techniques owe to foundational statistics. The rigorous frameworks we use today were shaped by statistical methods designed to manage uncertainty and validate assumptions. For instance, Jerzy Neyman's work on confidence intervals back in 1937 laid the groundwork for hypothesis testing—a critical step in making sure a data model actually reflects reality.
Later, Alan Turing's use of advanced Bayesian statistics to crack the Enigma code was a landmark moment. It showed how computational models and statistics could merge to solve incredibly complex problems, influencing the efficiency of early data processing. These milestones show how statistical theory is woven into the DNA of data modeling, ensuring our models are both accurate and trustworthy. You can discover more about the history of statistics and see how it continues to shape our field.
Making the Right Choice
At the end of the day, deciding between a relational and dimensional model comes down to one question: what are you trying to accomplish? It's rarely an either/or situation. Most organizations use both, working in harmony.
Data is first captured in a highly normalized relational database for day-to-day operations. Then, it's extracted, transformed, and loaded (ETL) into a denormalized dimensional model where it can be analyzed.
To make it even clearer, let's compare them side-by-side.
Relational vs Dimensional Modeling Use Cases
| Aspect | Relational Modeling (OLTP) | Dimensional Modeling (OLAP) |
|---|---|---|
| Primary Goal | Data integrity and consistency | Fast querying and reporting |
| Data Structure | Highly normalized (many small tables) | Denormalized (central fact table, few dimension tables) |
| Best For | Transactional systems (e.g., CRM, e-commerce, banking) | Analytical systems (e.g., data warehouses, business intelligence) |
| Operations | Fast for writing, updating, and deleting single records | Fast for reading and aggregating large datasets |
| Redundancy | Minimized to prevent anomalies | Intentionally included to boost query performance |
| User | Application developers, database administrators | Business analysts, data scientists, executives |
| Example Question | "What is the current shipping address for customer #5821?" | "What were the total sales for our top 5 products in the Northeast region last quarter?" |
Each model has its place, and understanding their core strengths is the key to building a robust data architecture that serves both your daily operations and your strategic goals.
Here is the rewritten section, crafted to sound completely human-written and natural, following the specified style and requirements.
Applying Modern Models for NoSQL and Big Data
For a long time, the structured, predictable world of relational databases was all we needed. They are fantastic for many business applications, but they start to buckle under the sheer weight and chaos of modern data. The explosion of information from social media feeds, IoT sensors, and endless user-generated content brought a scale that older models just weren't built for.
Think of it like trying to fit a river into a neat grid of ice cube trays. It’s just not the right tool for the job. Relational databases demand structured, uniform data, but "big data" is rarely so polite. It's often messy, semi-structured, or completely all over the place.
This is where NoSQL (Not Only SQL) data modeling comes in, offering a whole new toolkit designed for flexibility and massive scale.
The Big Shift to Schema-On-Read
One of the most important changes NoSQL brought to the table is the idea of schema-on-read. Traditional databases use a schema-on-write approach. This means you have to meticulously define the data's structure—the schema—before you can put any data into it. If your data doesn't fit that predefined mold, it gets rejected. Simple as that.
Schema-on-read flips this completely on its head. You can dump your data into the database in its raw, messy format first and then figure out how to interpret and structure it when you pull it out to read it. This gives you incredible flexibility, letting you store all sorts of diverse data without having to design a rigid, one-size-fits-all container beforehand.
This shift didn't happen in a vacuum. Around 2005, the concept of Web 2.0, first described by Tim O'Reilly, changed everything. The web became a two-way street, moving from static, service-generated content to dynamic, user-generated content. This unleashed a firehose of unstructured data that relational databases just couldn't handle. The launch of Hadoop in 2006 was a pivotal moment, giving us a cost-effective way to manage these huge datasets and paving the way for the flexible schema-on-read models we rely on today. You can discover more about data modeling's evolution and how it adapted.
A Look at the Main NoSQL Database Models
NoSQL isn't one single thing. It's a whole category of databases, and each type has its own way of modeling data for specific jobs. Let's break down the four main players.
- Document Databases (like MongoDB): These store data in flexible, JSON-like documents. Because every document can have its own unique structure, they're perfect for things like user profiles, product catalogs, or content management systems where the data fields can vary wildly from one entry to the next.
- Key-Value Stores (like Redis): This is the simplest model of all, working like a giant dictionary. You store data as a collection of unique keys and their corresponding values. It’s lightning-fast for simple lookups, making it a go-to for caching website data, storing user preferences, or powering real-time leaderboards.
- Column-Family Stores (like Cassandra): While relational databases organize data in rows, these databases organize it in columns. This makes them incredibly efficient for queries that need to scan millions of rows but only care about a few specific columns—a common task in analytics or when handling time-series data from IoT sensors.
- Graph Databases (like Neo4j): These models are all about relationships. Data is stored as nodes (the "things," like people or products) and edges (the connections between them). This is the obvious choice for managing deeply interconnected data, like in social networks, fraud detection systems, or recommendation engines that tell you "customers who bought this also bought...".
Choosing the Right Tool for the Job
It’s really important to remember that NoSQL isn't here to kill SQL. Relational databases are still the best choice for applications that need rock-solid data integrity and complex transactions, like banking systems or e-commerce order processing.
NoSQL databases are complementary tools in the modern data architect's toolkit. They excel where relational databases falter—specifically with massive data volume, high velocity, and unstructured variety.
The trick is to pick the data model that actually fits the problem you're trying to solve. Need to build a professional network where connections are everything? A graph database is your best friend. Caching user data to make your app feel snappy? A key-value store will do the trick. Building a flexible content platform? Go with a document database.
By understanding how these modern models work, you can build systems that aren't just powerful, but are perfectly designed for the unique challenges of big data.
Common Data Modeling Questions Answered
As you start getting your hands dirty with data modeling, a few questions always seem to surface. It’s totally normal to get a little hung up on the subtle differences between models or to wonder how all this theory actually plays out in the real world.
Let's tackle some of the most common sticking points head-on. Here are some straightforward, practical answers to help you get unstuck and feel more confident.
What Is the Main Difference Between a Logical and a Physical Data Model?
Think of it like this: a logical model is the architect's blueprint, while a physical model is the construction contractor's detailed building plan. Both describe the same house, but they’re made for different people and serve different purposes.
The logical data model is the blueprint. It lays out all the data elements and how they relate to each other from a business standpoint. It carefully maps out what data the system needs—like Customers and Products—without worrying about the specific technology that will be used to store it. It's totally technology-agnostic.
The physical data model, on the other hand, is the builder's plan. It translates the blueprint for a specific database, like PostgreSQL or MongoDB. This model gets into the nitty-gritty of how the data will actually be stored, defining concrete details like table names (tbl_customers), data types (VARCHAR(255)), and the indexes needed to make it run fast.
When Should I Use a NoSQL Database Over a Relational One?
This really comes down to one core question: are you prioritizing strict consistency or flexible scale?
Go with a relational (SQL) database when data integrity and accuracy are absolute must-haves. These are the gold standard for systems where every transaction has to be perfect. Think about:
- Financial platforms processing payments
- E-commerce sites keeping orders and inventory straight
- HR systems managing sensitive employee records
Choose a NoSQL database when your biggest headaches are massive scale and flexibility. It’s the right call when you're dealing with huge amounts of unstructured data, need to grow at a blistering pace, or want a schema that can change on the fly. Good fits include:
- Social media feeds with ever-changing content
- Real-time analytics from thousands of IoT sensors
- User session data for a huge web app
Basically, if your data has to be predictable and airtight, stick with SQL. If it’s big, messy, and needs to scale fast, NoSQL is your best friend.
Is Normalization Still Relevant with Modern Databases?
Absolutely. While the database world has expanded way beyond traditional relational systems, the core ideas behind normalization are as important as ever.
For the relational databases that run most day-to-day business operations (OLTP systems), normalization is the foundation of data integrity. It’s what stops weird data anomalies, cuts down on redundant information, and makes sure that when you update something, it gets updated correctly everywhere. Transactional systems would be a chaotic mess without it.
Normalization isn't some outdated concept; it's a core principle of smart data design. Even when you intentionally denormalize for performance, that choice is far more effective when you understand exactly what you're giving up.
Even in the world of analytics, where we often use denormalized structures like the star schema for faster reporting, knowing your normalization rules is crucial. It helps you make a conscious, informed trade-off between integrity and speed. It’s a concept every data pro needs to have in their back pocket.
How Do I Get Started with Data Modeling?
The best way to learn is by doing. You can read all the theory you want, but the concepts only truly click when you start putting them into practice.
Start small, with a project you know inside and out. Don't try to model a massive enterprise system on your first go. Pick something from your own life:
- A personal library to track your books.
- A recipe collection with ingredients and instructions.
- A simple contact list for your friends and family.
Kick things off with a conceptual model on a whiteboard or a piece of paper. Just draw out the main "things" (entities) like Book, Author, and Publisher. Next, build a logical model by giving each entity its attributes (Book has a Title, ISBN, PublicationDate) and figuring out the relationships between them.
Finally, try building it out in a simple, free tool like SQLite. Walking through the process from a high-level idea to a working database is hands-down the best way to build your skills. Before you know it, you’ll be ready to apply these same steps to much bigger, real-world problems. For a deeper look at getting your data ready for analysis, check out our guide on the 7 data scrubbing techniques to master for pristine data.
Ready to show off your data expertise in the real world? At SumproductAddict, we create witty, high-quality apparel and office gear for people who live and breathe spreadsheets. From hoodies to desk mats, find the perfect way to celebrate your passion for data. Explore our collection today!