
How to Do What If Analysis in Excel Like a Pro
Why What If Analysis Will Transform Your Decision Making
 You’ve probably performed what-if analysis dozens of times without ever calling it that. Every time you’ve wondered, "What happens to our profit if sales drop by 20%?" or "How many more units must we sell to hit our quarterly target?" you were thinking strategically. The only difference is you were likely using gut feelings and back-of-the-napkin math. Microsoft Excel is built to do that heavy lifting for you.
Moving from guesswork to data-backed foresight is where the real value lies. When you learn how to do what-if analysis in Excel, you’re not just picking up a technical skill; you're adopting a new way of making decisions. You can test your assumptions and explore outcomes before you commit, turning big risks into calculated moves.
From Mental Math to Data-Driven Models
One of the biggest myths is that these tools are only for finance pros with massive, complicated spreadsheets. That couldn't be more wrong. At its heart, what-if analysis simply gives structure to the questions you're already asking. You create a simple model that reflects your business and then play out different futures within it.
This process takes the anxiety out of financial forecasting. Instead of worrying about an unknown future, you can map out the optimistic, pessimistic, and most likely scenarios and plan for each. Knowing you’ve explored the possibilities brings a ton of confidence.
You can find the main What-If Analysis tools on the Data tab in Excel’s ribbon. In the Forecast group, you'll find the dropdown menu that contains the three core functions you'll come to rely on: Scenario Manager, Goal Seek, and Data Table.
Real Stories, Real Results
The practical uses are what make these tools so powerful. Imagine a retail manager with a warehouse full of last season’s winter coats as spring approaches. She needs to clear out this inventory without destroying her profit margin.
- Instead of just guessing at a discount, she uses Goal Seek. She sets her target profit for the coats to a break-even point and lets Excel calculate the exact discount percentage needed to hit that number. The result is a smart clearance sale that improves cash flow while protecting the bottom line.
Now, think about a startup founder getting ready for a big investor meeting. She knows her financial projections will be under a microscope.
- She uses Scenario Manager to build three distinct growth plans: a conservative base case, a realistic target, and an ambitious best-case scenario. When an investor asks, "What if your customer acquisition cost is 15% higher than you projected?" she can instantly show them the 'pessimistic' model, proving the business is resilient. This preparation doesn't just answer a question; it builds incredible trust.
These examples show that what-if analysis isn't an abstract concept. It's a hands-on tool for solving everyday business problems and answering tough questions with confidence. It gives you a risk-free digital sandbox to explore your decisions, ensuring the choices you make in the real world are smart and strategic.
Building Your Excel Foundation for Bulletproof Analysis
Here’s a secret I've learned over years of building financial models: your what-if analysis is only as reliable as the spreadsheet it's built on. It’s so tempting to dive right into the tools, but without a solid, organized structure, you’re just creating a house of cards. A little foresight in how you set up your workbook is the difference between a confusing mess and a strategic tool you can trust and reuse for months.
Separate Your Inputs, Calculations, and Outputs
The most critical habit for a strong model is separating your sheet into three distinct zones. Think of it as creating a clean, logical workflow that anyone can understand at a glance.
- Inputs/Assumptions: This is your control panel. Group all the variables you plan to tweak—like Sales Growth Rate, Material Costs, or Ad Budget—in one easy-to-find section. I always give this area a light blue or gray background to make it obvious these are the cells to change.
- Calculation Engine: This is the "black box" of your model. It contains all the formulas that connect your inputs to your results. Once it's built correctly, you should rarely need to touch it. Its job is to just work.
- Outputs/Summary: This is your dashboard, where you display the key results you care about, such as Net Profit, Return on Investment, or Breakeven Point.
This simple separation makes it immediately clear how your assumptions drive your outcomes and, more importantly, it prevents you or a colleague from accidentally typing a number over a crucial formula.
Use Named Ranges and Clear Labels
A formula like =F5*(1-G12) is a headache waiting to happen. In a month, you'll have no idea what F5 or G12 represent. This is where Named Ranges are an absolute game-changer for learning how to do what if analysis in Excel. Instead of cryptic cell references, you give them plain-English names.
That same formula could become =Total_Revenue*(1-Tax_Rate). Instantly, the logic is clear. To create one, just select a cell or range, type a descriptive name into the Name Box (to the left of the formula bar), and hit Enter. This simple habit makes your work self-documenting and a breeze to troubleshoot later.
A well-structured model might dedicate specific, color-coded sections for assumptions and key outputs, making it instantly understandable.

This visual approach guides the user and protects the model's calculation engine from accidental changes.
Build in Guardrails with Data Validation
Even with a perfect layout, human error happens. That’s why Data Validation is your essential safety net. This feature lets you set rules for what kind of data can be entered into a cell, catching mistakes before they can mess up your analysis. It’s the key to building a tool that others can use with confidence.
For example, you could stop bad data at the source:
- Restrict an input for a discount percentage to a decimal between 0 and 1.
- Create a dropdown list of regions to prevent typos like "Noth" instead of "North."
- Ensure a cell for a project deadline only accepts a valid date.
This proactive error-proofing is fundamental for any analysis you plan to share or reuse. It’s surprisingly simple to implement, and you can get the full rundown in our guide on how to use data validation in Excel.
With your spreadsheet foundation now solid, you're ready to deploy Excel's powerful analysis tools. Each one answers a different kind of question, so choosing the right one is key.
Excel What If Analysis Tools Comparison
A comprehensive comparison of Excel's three main what-if analysis tools showing their best use cases, complexity levels, and typical scenarios
| Tool | Best For | Variables | Complexity | Output Type |
|---|---|---|---|---|
| Scenario Manager | Comparing a few distinct outcomes (e.g., best, worst, likely case). | Many inputs (up to 32) | Medium | A summary report comparing scenarios side-by-side. |
| Goal Seek | Finding the one specific input needed to achieve a desired result. | One single input | Low | Directly changes the input cell to the required value. |
| Data Tables | Visualizing how one or two variables impact multiple formulas across a range. | One or two inputs | Low to Medium | A grid of all possible outcomes based on the input range. |
Ultimately, the best tool depends on your goal. Are you comparing a few detailed scenarios, solving for a specific target, or exploring the impact of a changing variable? Matching the tool to your question is the secret to effective what-if analysis.
Data Tables: Your Secret Weapon for Multiple Scenarios
While Scenario Manager is perfect for comparing a few different business plans, Data Tables are what you need when you want to see how one or two key variables can affect your outcome across hundreds of possibilities. Think of them as a flight simulator for your numbers. They let you map out every potential result without having to manually plug in numbers over and over again. Honestly, mastering this is a huge step in learning how to do what if analysis in Excel.
The Simplicity of One-Variable Tables
Let's start with a common situation. Imagine you're a freelance consultant trying to figure out your ideal hourly rate. You've built a small model to calculate your annual net income based on your rate, billable hours, and expenses. A one-variable data table lets you see exactly how your income shifts as you test a range of rates—say, from $75 to $150 an hour.
All you do is create a column with every rate you want to test. In the cell next to the top of your list, you simply point to your final net income formula. Then, with a quick trip to the Data Table menu, Excel does the heavy lifting, instantly calculating your net income for every single rate. It's that simple.
Take a look at this two-variable table, which shows a classic business problem: analyzing a loan.

This grid immediately shows the monthly payment for every combination of interest rate and loan term. This kind of clarity helps you make smart trade-offs between a lower rate and a shorter repayment schedule.
Revolutionize Planning with Two-Variable Tables
This is where things get really powerful. A two-variable data table shows you how two inputs work together to influence a single result. Let's say a restaurant owner is deciding on the price for a new menu item. She needs to understand how the menu price (Variable 1) and the potential change in customer traffic (Variable 2) will affect her overall profit.
She can set up a grid with different prices running down the side and various customer volume scenarios across the top. The data table then fills in the grid, showing her the projected profit for every single price-and-volume mix. Suddenly, she can spot the "sweet spot"—the price that brings in the most profit, even if it means serving slightly fewer customers.
The Data Table feature is fantastic for this kind of financial forecasting. A business exploring an investment can list different interest rates (e.g., 3%, 5%, 7%) and let the table calculate the future value for each one. They might discover that an interest rate jump from 3% to 5% could increase the future value by 10%. These insights are critical when small changes in assumptions can have a huge financial impact. You can explore more powerful Excel techniques in this video.
Navigating Common Data Table Pitfalls
Data tables are incredible, but they can be a source of frustration if you're not aware of their quirks. Here are a few common tripwires I've seen and how to avoid them:
- The Classic Input Cell Mix-Up: This is the number one mistake. When the dialog box asks for the "Row input cell" and "Column input cell," you must select the original input cells your master formula relies on. Don't select cells inside the data table you just created.
-
The Mysterious #VALUE! Error: If your table fills up with errors, check the top-left corner cell of your table's structure. This cell needs to contain a direct reference to your final output formula (for example,
=B5, where cell B5 holds your "Net Profit" calculation). -
The Uneditable Grid: The results in a data table are an array formula, which you'll see as
{=TABLE(B10,B9)}in the formula bar. This means you can't edit or delete a single cell within the results. To make a change, you have to adjust your original formula, the input variables, or delete the entire table and start again.
Advanced Use Cases: Beyond Basic Forecasting
Once you're comfortable with the basics, you can apply data tables to much more detailed analysis. In risk assessment, for instance, you could model how your profit margin reacts to different inflation rates and raw material costs at the same time. This kind of sensitivity analysis clearly shows which business assumptions pose the biggest threat to your bottom line.
By pairing Data Tables with other functions, you can build some seriously insightful financial models. For example, some of the most robust financial projections are built on this very tool. To get an idea of how functions can work together, you can check out our guide on 3 surprisingly useful ways to use SUMPRODUCT in Excel. Ultimately, Data Tables move you from asking "what if" about one change to seeing the entire landscape of possibilities at a glance.
Goal Seek: Reverse Engineering Your Success Metrics
While Data Tables are fantastic for exploring a range of outcomes, sometimes your question is much more direct. You already have a destination in mind; you just need the exact route to get there. You're not asking what if a variable changes, but rather what must happen for you to hit a specific target. This is where Goal Seek shines. It flips the analysis on its head by starting with the desired result and working backward to find the single input you need to change. It's the perfect tool for reverse engineering your success.
From Target to Tactic
Imagine you're a freelancer building your annual financial plan. You've set a non-negotiable goal to take home $80,000 in net income after all your expenses and taxes. Your spreadsheet already has all the formulas linking your billable hours, hourly rate, and costs to that final net income number. Instead of manually plugging in different numbers for your billable hours until you land on the magic number, you can use Goal Seek. You just tell Excel: "Set my net income cell to $80,000 by changing my total billable hours cell." In a flash, Excel runs the numbers and tells you exactly how many hours you need to work.
This is an essential function for any business performing a what if analysis in Excel. For example, a company looking to increase its profit margin from 15% to a more ambitious 20% can use Goal Seek to find out what needs to change. By setting the profit margin cell to 20%, the tool can calculate the exact sales volume needed to reach that goal, perhaps showing that sales must increase by 25%, assuming other costs stay the same. This lets you quickly see what levers you need to pull to hit your targets. You can find out more about how Excel handles this kind of analysis on Microsoft's official support page.
Putting Goal Seek into Action
To get this wonderfully simple feature working for you, head to the Data tab, click the What-If Analysis dropdown menu, and choose Goal Seek. This brings up a small, clean dialog box with just three fields to fill out—it's everything you need to solve for your goal.
Here’s a look at the Goal Seek dialog box, which is your command center for this whole operation.
This little tool asks for three things: your outcome cell, your target number, and the one variable you can control.
- Set cell: This must be the cell containing the formula you want to solve—it’s your destination. In our freelance example, this would be the cell that calculates your final net income.
- To value: This is the specific number you want your formula to hit. For our freelancer, this value is 80000.
- By changing cell: This must be a cell that does not have a formula and is a direct or indirect input for your "Set cell." It's the single lever you can pull, like the cell for your total billable hours.
When Goal Seek Hits a Wall
As simple as it is, Goal Seek isn't foolproof. If it can't find a solution, it's usually for a pretty logical reason. The most common problem is that the "By changing cell" has no mathematical link to the "Set cell." There must be an unbroken chain of formulas connecting them. If you can change the input manually and the output cell doesn't budge, then Goal Seek won't be able to find a solution either.
Another issue is asking for a mathematically impossible result. If you ask Goal Seek to generate $1,000,000 in profit by only changing a $500 office supply budget, it's going to fail because the numbers just don't add up. It's a powerful calculator, not a magician. Finally, always remember its biggest limitation: Goal Seek can only change one single input cell. When your problem involves balancing multiple variables—like price, marketing spend, and production costs—you’ll need to use a more robust tool like Scenario Manager or Excel's Solver add-in.
Scenario Manager: Building Comprehensive Business Models
When business decisions get messy and a couple of variables just won’t tell the whole story, Scenario Manager in Excel is the tool you need. While Data Tables are great for testing one or two inputs and Goal Seek is perfect for finding a single target, the real world is far more complex. A product launch isn't just about price; it’s about marketing spend, material costs, and competitor moves all happening at once.
Scenario Manager is built for this kind of complexity, letting you bundle up to 32 different input values and save them as a single, cohesive scenario. This elevates your analysis from a simple 'best case vs. worst case' to a more strategic exploration. You can craft scenarios that tell a story: 'Aggressive Market Entry,' 'Conservative Q4 Forecast,' or 'Supply Chain Disruption,' each capturing a potential future based on a unique set of assumptions.
Choosing the Right Tool: Scenario Manager vs. Data Tables
Before diving into creating scenarios, it's helpful to know when to use Scenario Manager versus the simpler Data Tables. This quick guide breaks down which tool is best for your specific analysis.
Scenario Manager vs Data Tables Usage Guide
A practical guide showing when to use Scenario Manager versus Data Tables based on your analysis needs and complexity requirements
| Analysis Type | Number of Variables | Recommended Tool | Output Format | Best Use Case |
|---|---|---|---|---|
| Single or Dual Variable Sensitivity | 1 or 2 | Data Table | A grid of results on the current worksheet | Quickly see how changing interest rates affect loan payments or how price and unit cost impact profit. |
| Multi-Variable Strategic Modeling | Up to 32 | Scenario Manager | A new summary worksheet or a PivotTable report | Modeling a complete business plan with multiple inputs like sales volume, price, marketing budget, and operational costs. |
Ultimately, your choice depends on complexity. For quick checks on one or two key drivers, a Data Table is fast and efficient. For building and comparing complete strategic alternatives, Scenario Manager is the way to go.
Crafting Meaningful Business Scenarios
The real value of learning how to do what if analysis in Excel with Scenario Manager is in building realistic models that reflect your business. Let's say you're planning a new software subscription launch. Your key variables—what Excel calls "changing cells"—might include:
- Monthly Subscription Price
- Customer Acquisition Cost (CAC)
- Monthly Marketing Budget
- Customer Churn Rate
You could then build out a few distinct scenarios to show your team. A 'Bootstrapped Growth' scenario might have a low price and a tight marketing budget. In contrast, a 'High-Growth Blitz' would involve a premium price and a huge marketing spend to grab market share.
To get started, head to Data > What-If Analysis > Scenario Manager and click 'Add.' From there, you'll give your scenario a clear name, select your changing cells, and plug in the specific values for that version of reality. Just remember, the power of your scenarios is directly tied to the quality of your underlying spreadsheet. For a deeper look at setting up your model, our guide on how to build financial models in Excel can be a huge help.
At their core, all what-if tools work on a similar principle, even if Scenario Manager handles far more moving parts. This simple visual shows the basic relationship between an input you change and the outcome you're measuring.
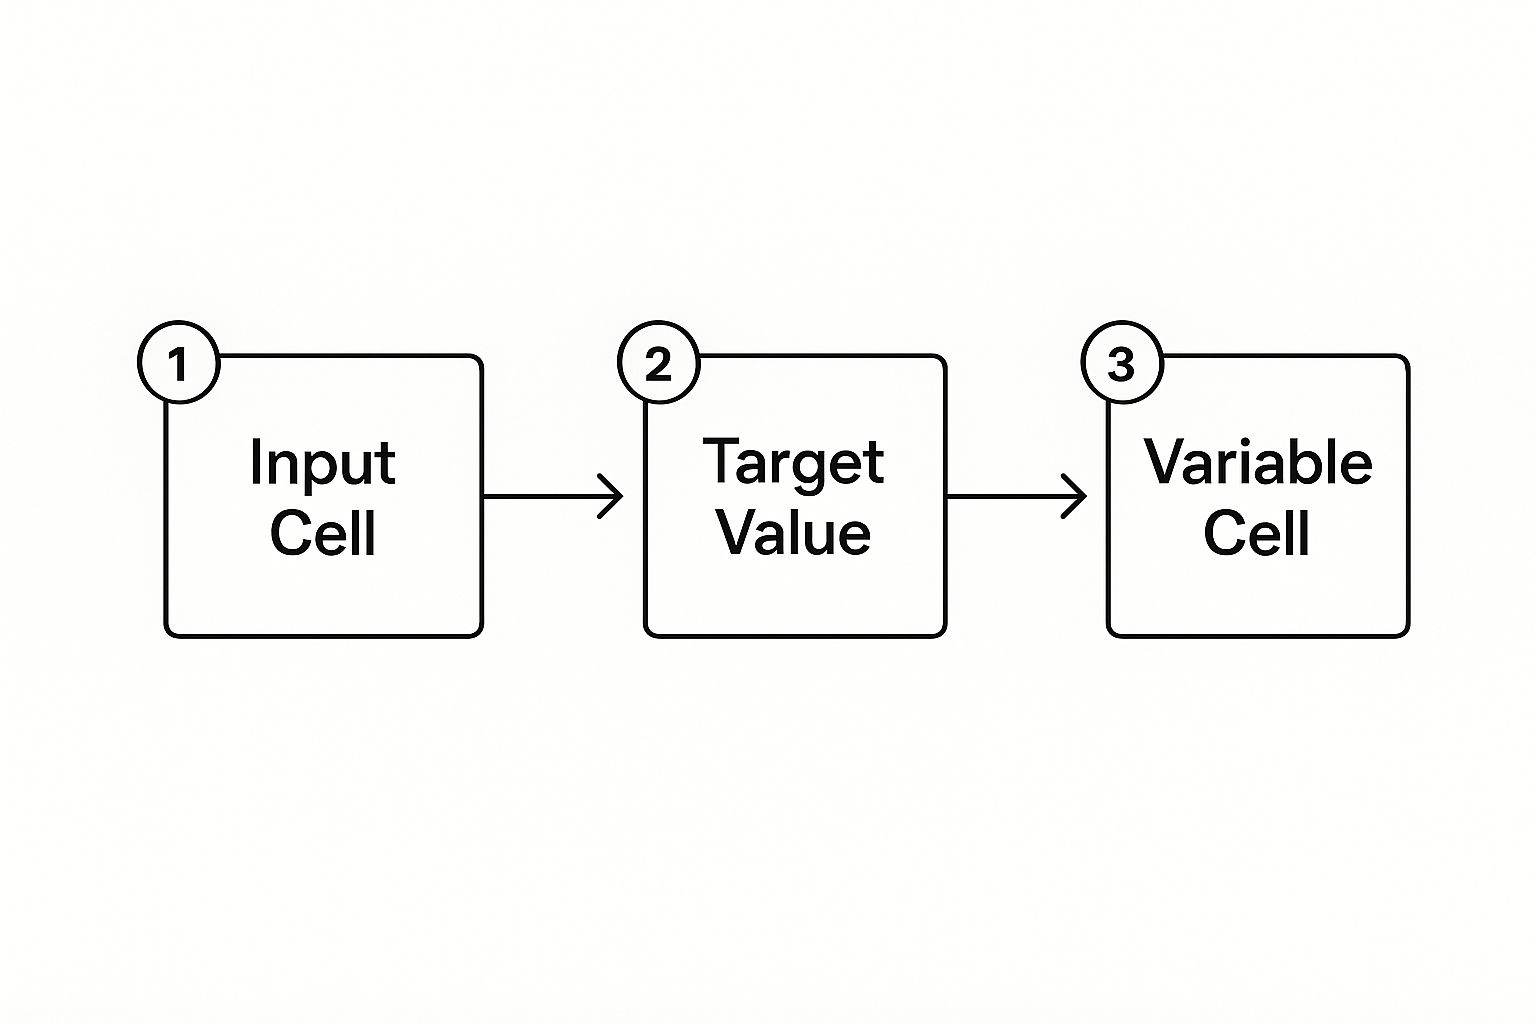
This process—changing a variable to influence an outcome—is the fundamental concept that Scenario Manager expands upon to handle much more complex models.
Presenting Your Findings: The Scenario Summary Report
After you've built your different scenarios, the real payoff comes from the Scenario Summary Report. With a single click on 'Summary...', Excel creates a brand-new worksheet that neatly tables all your scenarios side-by-side. It displays the values for each changing cell and, more importantly, the results for your key outcomes like 'Net Profit' or 'Year 1 Subscribers.'
This report is incredibly useful in meetings. It turns a complex model into a clear, digestible comparison of potential paths, directly answering the question, "What do these different futures look like, and which one should we choose?"
Here's a pro-tip many people overlook: you can also create a Scenario PivotTable report. This gives you an interactive summary, letting you and your team slice and filter the results on the fly—perfect for exploring questions that come up during a presentation.
Scenario Manager also allows you to merge scenarios from different workbooks, which is ideal for collaborative projects where different teams own different parts of the forecast. For this to work well, each model must have a consistent and logical structure.
This visual reinforces a critical point: defining your inputs and outputs clearly is essential. This foundation becomes non-negotiable when you start combining complex models from different sources to get a complete picture of potential business outcomes.
Real World Applications That Drive Business Results
Knowing the mechanics of Excel’s what-if tools is one thing, but the real breakthrough happens when you see them solve messy, real-world business problems. Professionals rarely use just one feature in isolation. They combine them to paint a full picture of what the future could hold. Learning how to do what if analysis in Excel is about moving beyond theory to make high-stakes decisions with confidence. Let's see how this plays out in a couple of common scenarios.
The Retail Buyer's Inventory Dilemma
Imagine a retail buyer staring down the barrel of the upcoming summer season. She has to decide how many units of a new flagship dress to order. If she orders too few, she's leaving money on the table. If she orders too many, she'll be stuck with costly markdowns at the end of the season. Her biggest headaches are the selling price and the completely unpredictable demand.
Instead of just guessing, she turns to a two-variable Data Table. She sets up a grid with potential selling prices like $49.99, $59.99, and $69.99 along one axis and different demand scenarios (Low, Medium, High) along the other. Excel instantly fills in the table, showing her the projected gross profit for every possible outcome. This immediately helps her spot the sweet spot—maybe the $59.99 price gives her the best shot at high profits without the huge risk that comes with the higher price if demand falls flat.
The Manufacturer's Profit Puzzle
Now, let's switch gears to a manufacturing plant manager. Her goal is to hit a $500,000 quarterly profit target, but she needs to figure out the right mix of production volume and pricing to get there. This is a perfect job for a combination of all three what-if tools.
First, she uses Goal Seek to work backward. She asks Excel a simple question: "To hit my $500,000 profit target, how many units do I need to produce at my current price?" Goal Seek spits out the exact number. But what if her costs go up? She then builds a Data Table to run a quick sensitivity check, seeing how her profit changes if raw material costs swing by +/-15%.
Finally, she pulls it all together with Scenario Manager. She creates an 'Aggressive Growth' scenario with a lower price and higher ad spend, and a 'Premium Margin' scenario with a higher price and more targeted marketing. The summary report compares these strategies side-by-side, giving her a clear, data-backed plan to present to her leadership team.
Uncovering Your Most Critical Assumptions
This whole process of testing your variables is called sensitivity analysis. Its main job is to show you which of your assumptions have the biggest impact on your final numbers. A fantastic way to visualize this is with a tornado chart.
The variables at the top with the longest bars are the ones that can make or break your forecast. The ones at the bottom don't move the needle as much. This tells you exactly which numbers you need to be most confident about.
From Analysis to Action
At the end of the day, an analysis is only good if it leads to a decision. Once your model is built, you can't waste time manually updating it. For those who want to take it a step further, it's possible to build systems that automate data analysis for faster business insights, turning your spreadsheets into living reports.
A piece of hard-won advice: always validate your results. Do a gut check. Do the numbers make sense in the context of the real world? This step is critical. When you present your findings, fight the urge to just throw a giant grid of numbers on the screen. The goal is to provide clarity, not just complexity. Tell the story behind the data. Use charts to show the trade-offs and explain your recommendation in plain language. A brilliant analysis that nobody understands is a wasted effort.
Troubleshooting and Professional Best Practices
So you've built your what-if model, but the results look... off. Or worse, Excel is throwing errors. Don't panic. Hitting a snag is a normal part of building any meaningful analysis. The real skill is knowing how to quickly fix what’s broken and, even better, adopting habits that prevent these issues in the first place.
Diagnosing Common What-If Analysis Errors
One of the most common culprits is the dreaded circular reference, where a formula ends up referring back to its own cell. This creates an endless loop that can make your workbook freeze. Excel is usually good about warning you, but finding the source can be tricky. My go-to move is using the Error Checking tools on the Formulas tab to trace the logic and untangle the knot.
Another head-scratcher is when Goal Seek gives you an absurd answer, like a negative number for units to produce. This isn't a glitch in Excel; it’s a sign that the logic in your model has a blind spot. Your formulas need to reflect real-world limits. Setting up Data Validation on your input cells from the start is a great way to prevent these nonsensical outcomes.
Finally, there’s the frustrating moment when a Data Table refuses to calculate. Before you start rebuilding the whole thing, check your calculation options under File > Options > Formulas. It’s likely set to "Automatic Except for Data Tables," a setting designed to improve performance. Just force a manual recalculation by hitting the F9 key.
Professional-Grade Techniques for Robust Models
When your what-if analysis in Excel starts to lag, it’s tempting to blame your computer. More often, the problem is inefficient formulas. Avoid using entire column references like A:A. A much better approach is to use structured references within formatted Excel Tables, which are significantly faster.
Your analysis is useless if you can't decipher it six months from now. Document your assumptions like your job depends on it—because it might. Create a dedicated 'Assumptions' tab or add detailed notes to key input cells that explain why you chose specific values. This simple practice turns a personal spreadsheet into a valuable team asset.
A sophisticated model is worthless if it's built on flawed data. A critical, non-negotiable step is ensuring your inputs are clean. For a deeper look into this foundational practice, check out our guide on 7 data scrubbing techniques to master pristine data.
To build real confidence in your model, you have to try to break it. Stress-test it with extreme scenarios. What happens if sales drop to zero or costs double? These aren't predictions; they are exercises to see if your model holds together under pressure. A model that stays stable is one you can truly trust.
These practices elevate your work from a simple calculation to a reliable decision-making tool. It's about building models that are correct, robust, and transparent. And when you're ready to show off your data expertise, we've got you covered. From custom fleece jackets to mugs with your favorite formulas, find the perfect gear to celebrate your skills at SumproductAddict.